Sei Market (SEI/USD) Bearish Trend Nears Conclusion at $0.20
Estimated Reading Time: 3 minutes
Don’t invest unless you’re prepared to lose all the money you invest. This is a high-risk investment and you are unlikely to be protected if something goes wrong. Take 2 minutes to learn more

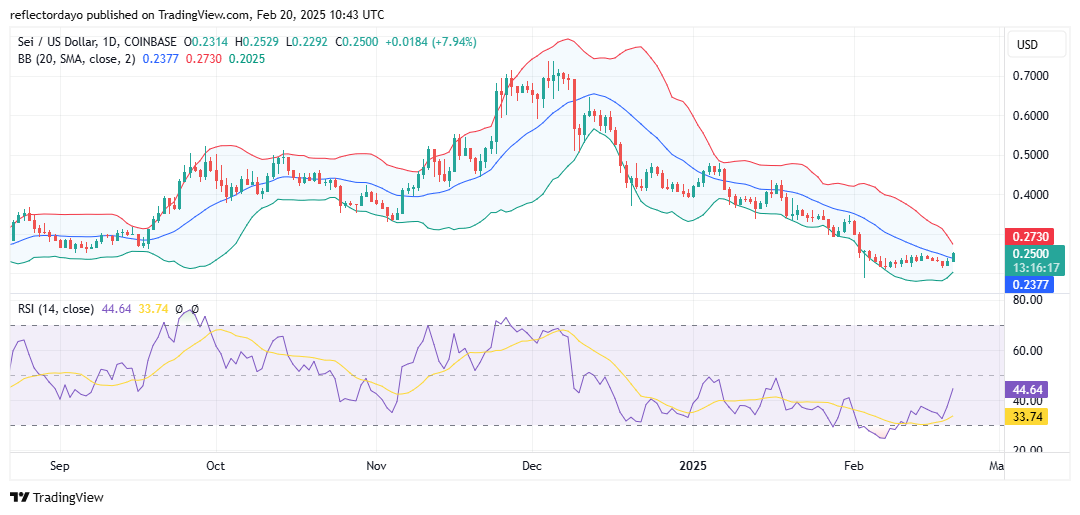
The Sei market has been in a strong bearish trend since December last year, with prices consistently forming lower lows and lower highs. Initially, traders rallied around the $0.40 price level between late last year and early this year, leading to a period of consolidation. However, the bulls lacked the strength to sustain the market at that level, ultimately resulting in a breakdown below $0.40.
The ensuing bearish sentiment further weakened bullish support at $0.30, causing the market to decline past this level as well. However, around the $0.20 price level, the market established a pivotal bounce, followed by a consolidation phase near $0.22.
In today’s trading session, the bullish momentum has shown a significant upward move, pushing the price toward the key $0.25 resistance level.
Sei Market Data
- SEI/USD Price Now: $0.248
- SEI/USD Market Cap: $1.2 billion
- SEI/USD Circulating Supply:4.6 billion
- SEI/USD Total Supply: 10 billion
- SEI/USD CoinMarketCap Ranking: #71
Key Levels
- Resistance: $0.25, $0.27, and $0.30
- Support: $0.22, $0.20, and $0.18.
The Sei Market Through the Lens of Indicators
Since the significant price drop in the Sei market on December 9, which caused the RSI to fall below the 50 level into bearish territory, the market has remained within the bearish zone, oscillating between the 50 and 30 levels. The actual price action has been in a continuous downtrend, breaking key support levels until it found a pivotal support at $0.20.
Bullish sentiment around this level has been strong enough to push the market upward, suggesting that a breakout into a full-fledged uptrend could be on the horizon. Notably, the Bollinger Bands are converging, indicating a sharp decline in volatility, likely due to an equilibrium between buyers and sellers. This volatility squeeze often precedes a significant price breakout in crypto signals.
Currently, the next target for the market appears to be the $0.30 price level. A successful breakout above this resistance could attract further bullish momentum, potentially fueling the emergence of a broader uptrend.
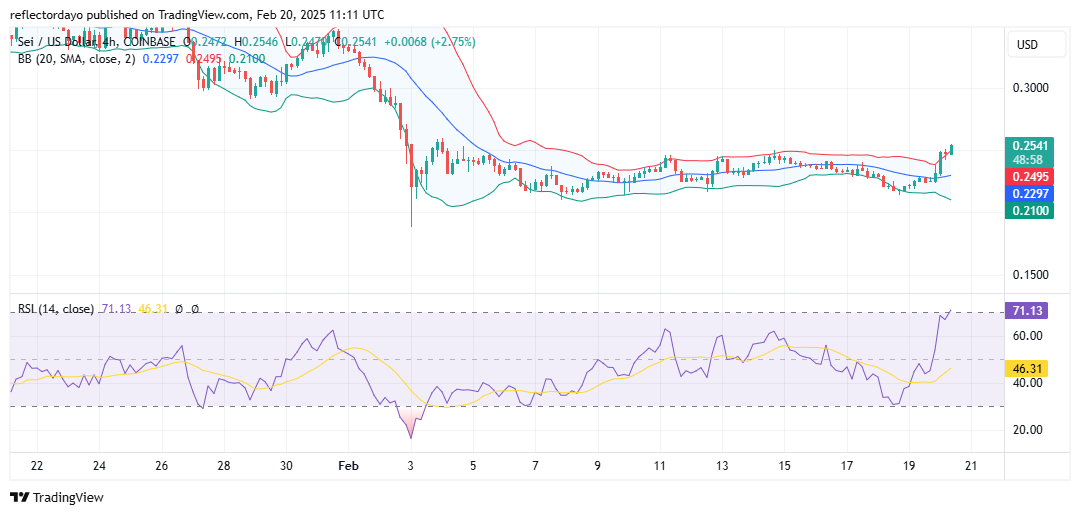
SEI/USD Price Prediction: 4-Hour Chart Analysis
A closer look at the 4-hour chart reveals that the bullish market is currently facing resistance at $0.25. A breakout at this level is crucial for the continuation of the recovery trend. At present, bullish traders are applying significant pressure at $0.25, challenging the bearish defense and attempting to push the market higher.
If the upward momentum continues, the price could surge toward $0.30. However, if a correction occurs, $0.25 may establish itself as a key support level, reinforcing the ongoing bullish recovery. Meanwhile, the Relative Strength Index (RSI) indicates that the market may be approaching overbought conditions, suggesting the possibility of a pullback.