Mog Coin (MOG/USD) Bear Market Stalls at $0.00000075 – Is a Rebound on the Horizon?
Estimated Reading Time: 3 minutes
Don’t invest unless you’re prepared to lose all the money you invest. This is a high-risk investment and you are unlikely to be protected if something goes wrong. Take 2 minutes to learn more

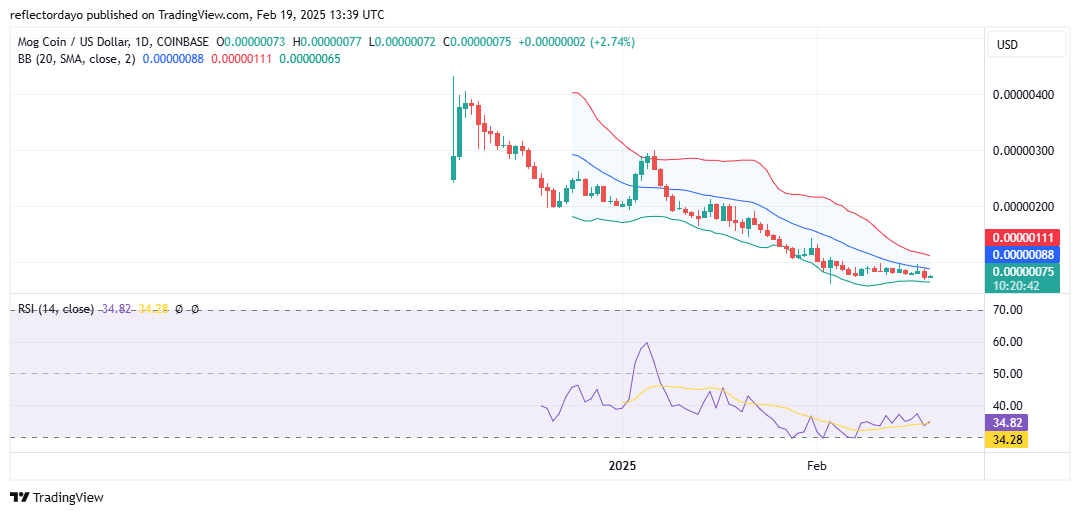
The Mog Coin market has exhibited significant volatility since its launch, or rather, since the first recorded historical data. After an initial surge that pushed the price to a peak of $0.00000434 on December 5, selling pressure emerged as profit-taking activity intensified at this high. This triggered a bearish trend, causing the price to break below initial support at $0.00000024—the level where bullish momentum initially appeared to originate.
Despite this key level acting as a potential support, it failed to reverse the downtrend. Similarly, the $0.0000001 support level also proved ineffective in halting the decline. However, the Mog Coin market appears to have found a temporary floor at $0.00000075, where price action has been consolidating since early February. This sideways movement suggests that bulls are beginning to show interest at this level, leading to a period of stabilization.
This pattern aligns with the typical behavior of meme coins, which often experience sharp price spikes followed by steep declines due to speculative trading and shifting market sentiment.
Mog Coin Market Data
- MOG/USD Price Now: $0.00000075
- MOG/USD Market Cap: $ 292.9 million
- MOG/USD Circulating Supply: 390.6 trillion MOG
- MOG/USD Total Supply: 390.6 trillion MOG
- MOG/USD CoinMarketCap Ranking: #167
Key Levels
- Resistance: $0.000001, $0.0000011, and $0.0000012
- Support: $0.0000007, $0.00000065, and0.0000006.
The Mog Coin Market Through the Lens of Indicators
The indicators are signaling a strong bearish market trend, with all key metrics placing the crypto, Mog Coin, firmly in the sell zone. However, a potential rebound appears to be forming as the market consolidates after reaching the $0.00000075 support level. Buyers have shown signs of resilience, managing to counteract the prevailing bearish pressure at this level.
This standoff between bulls and bears has persisted since early February, raising the question of whether buyers have enough strength to initiate a recovery or if they will ultimately succumb to selling pressure. As it stands, the market remains under significant bearish control. Price action is pressing heavily against this critical support level, while bulls are struggling to maintain their position against mounting downward pressure.
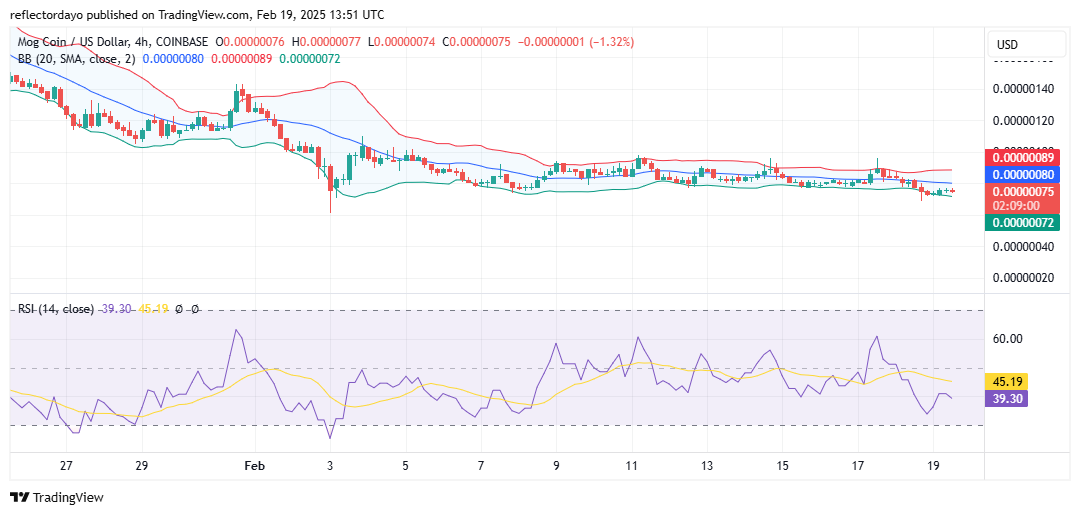
MOG/USD Price Prediction: 4-Hour Chart Analysis
One notable aspect of this market is that, as a memecoin, it relies heavily on community engagement. However, it appears that investors have been consistently selling off their holdings for quite some time.
On the 4-hour chart, the market has been consolidating along the $0.00000075 price level for an extended period, struggling to hold its ground against intense bearish pressure. If bulls fail to defend this key support, a potential breakdown could drive prices toward the $0.0000006 level. However, this level, which was previously tested during the bearish push on February 3, may serve as a regrouping point for buyers, potentially triggering a rebound.