The Shrub Market (SHRUB/USD): Poised for a Powerful Breakout?
Estimated Reading Time: 3 minutes
Don’t invest unless you’re prepared to lose all the money you invest. This is a high-risk investment and you are unlikely to be protected if something goes wrong. Take 2 minutes to learn more

The Shrub (SHRUB/USD) is a relatively new market, with historical data tracing back to November 13 of last year. The price experienced a significant surge, rallying from around the $0.05 level and gaining strong upward momentum. This bullish movement led to increased market volatility, driving the price to a peak of $0.25. However, the heightened volatility triggered a bearish reversal, as sellers capitalized on the price spike to take profits en masse. This resulted in sustained downward pressure, leading to a prolonged decline.
The Shrub Market Data
- SHRUB/USD Price Now: $0.0072
- SHRUB/USD Market Cap: $ 7 million
- SHRUB/USD Circulating Supply: 942 million
- SHRUB/USD Total Supply: 950 million
- SHRUB/USD CoinMarketCap Ranking: #1234
Key Levels
- Resistance: $0,015, $0.020, and $0.025
- Support: $0.00011, $0.00010, and $0.00009.
The Shrub Market Through the Lens of Indicators
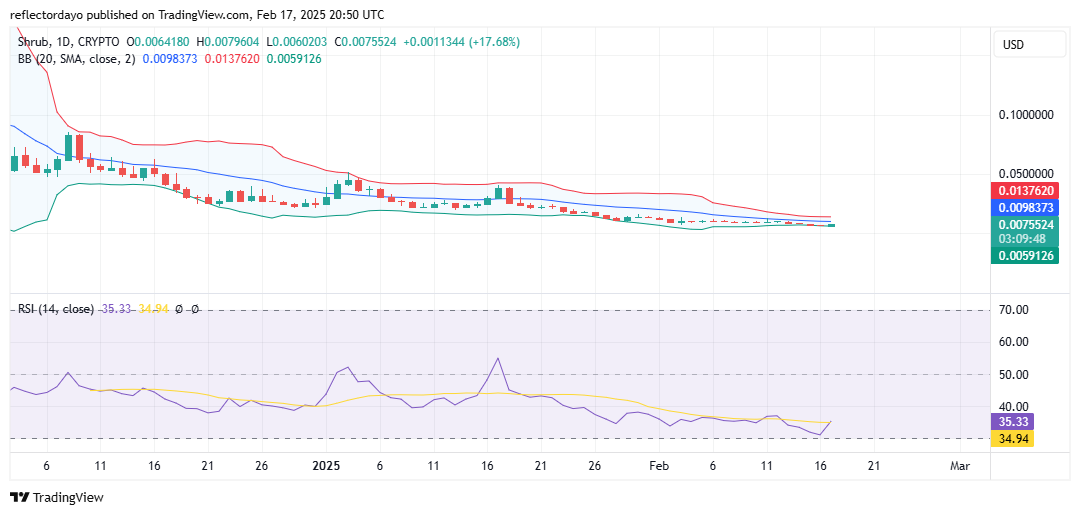
The Shrub market has remained under persistent bearish pressure since last year. Following the initial bearish breakout, the market quickly retraced to the level from which the previous surge began. As selling pressure continued, the bulls lost control of the key support at $0.05, leading to a decisive breakdown below this level.
Despite multiple attempts by traders to reclaim this support, bearish dominance has kept the price below $0.05. However, the crypto signal may be gearing up for an upward reversal. The appearance of four consecutive Doji candlesticks signals a stalemate between buyers and sellers, suggesting an imminent bounce. This is further supported by the Bollinger Bands, which are tightening around the price action at $0.0077, indicating a potential volatility spike. Additionally, the Relative Strength Index (RSI) is at 34, nearing oversold territory, making a bullish rebound more likely as traders look to enter long positions.
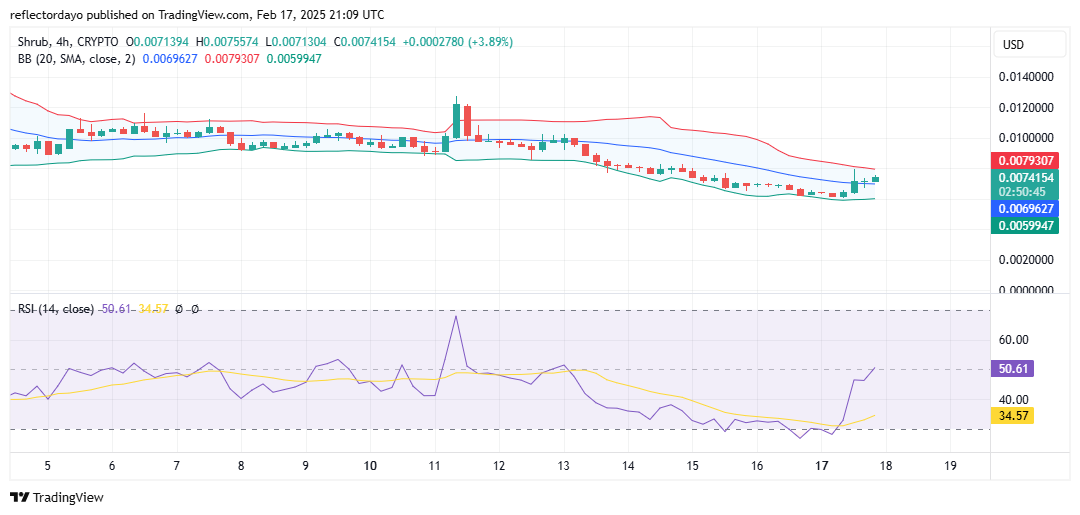
SHRUB/USD Price Prediction: 4-Hour Chart Analysis
Zooming into the 4-hour chart, we observe that the battle between buyers and sellers may still be ongoing, albeit with reduced intensity. The RSI line has rebounded from the oversold region, rising above the 50 level, indicating a potential shift in momentum. However, the actual price action has shown minimal movement, likely due to strong bearish resistance at the $0.008 level.
Sellers are asserting dominance around this critical level, limiting the expected upward movement. A decisive breakout above $0.008 is crucial, as it could trigger further bullish momentum and drive the price higher. Traders should closely monitor this level, as a successful breach may lead to sustained upward traction.