OFFICIAL TRUMP (TRUMP/USD) Shows Strong Recovery After Bearish Pressure
Estimated Reading Time: 3 minutes
Don’t invest unless you’re prepared to lose all the money you invest. This is a high-risk investment and you are unlikely to be protected if something goes wrong. Take 2 minutes to learn more

The Official Trump market made an impressive rebound in today’s trading session after enduring a prolonged bearish decline. This downturn followed a recent meteoric rise, with the market peaking at $80 before entering a downtrend.
Initially, bulls attempted to defend the $30 level, but selling pressure intensified as more traders offloaded their positions, causing the market to plunge further. A strong support finally emerged at $15, where buying interest surged, driving prices higher.
With this newfound bullish momentum, the key question remains: Can this recovery in the crypto signal be sustained? Let’s analyze what the indicators reveal about the market’s potential trajectory.
The OFFICIAL TRUMP Market Data
- TRUMP/USD Price Now: $21.51
- TRUMP/USD Market Cap: $ 4.4 billion
- TRUMP/USD Circulating Supply: 199.99 TRUMP
- TRUMP/USD Total Supply: 1 billion TRUMP
- TRUMP/USD CoinMarketCap Ranking: #29
Key Levels
- Resistance: $25, $30, and $35
- Support: $15, $10, and 9.
The OFFICIAL TRUMP Market Through the Lens of Indicators
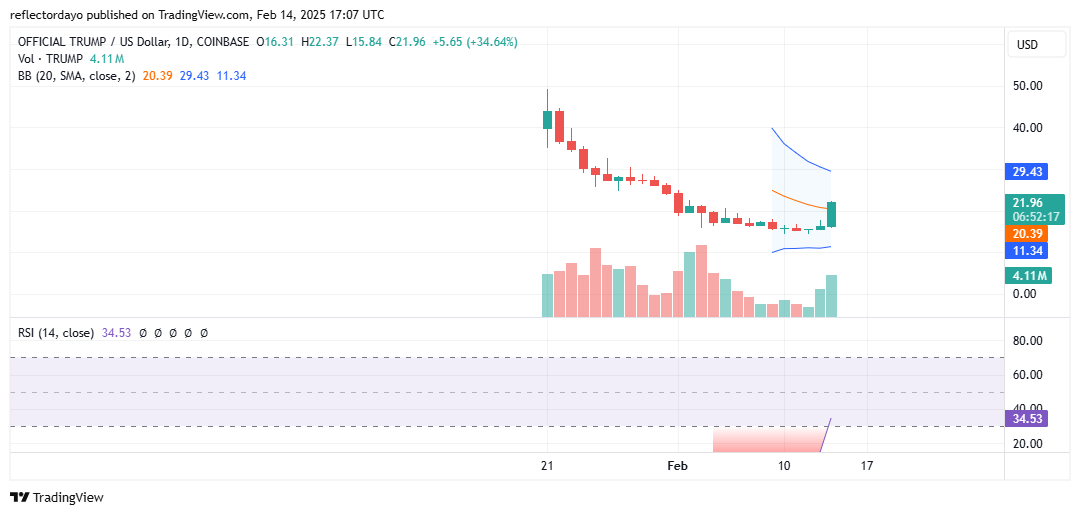
The Official Trump market shows promising signs that its current bullish recovery could be sustainable. Given its memecoin nature, further upward movement remains a strong possibility.
Notably, the price action has crossed above the 20-day moving average, signaling a shift toward bullish sentiment. Additionally, trading volume and the expanding histogram in the ongoing bullish session indicate strong market interest, further driving prices upward.
Moreover, the Relative Strength Index (RSI) suggests the market is heavily oversold, which is likely to attract traders looking to enter long positions, reinforcing the potential for continued bullish momentum.
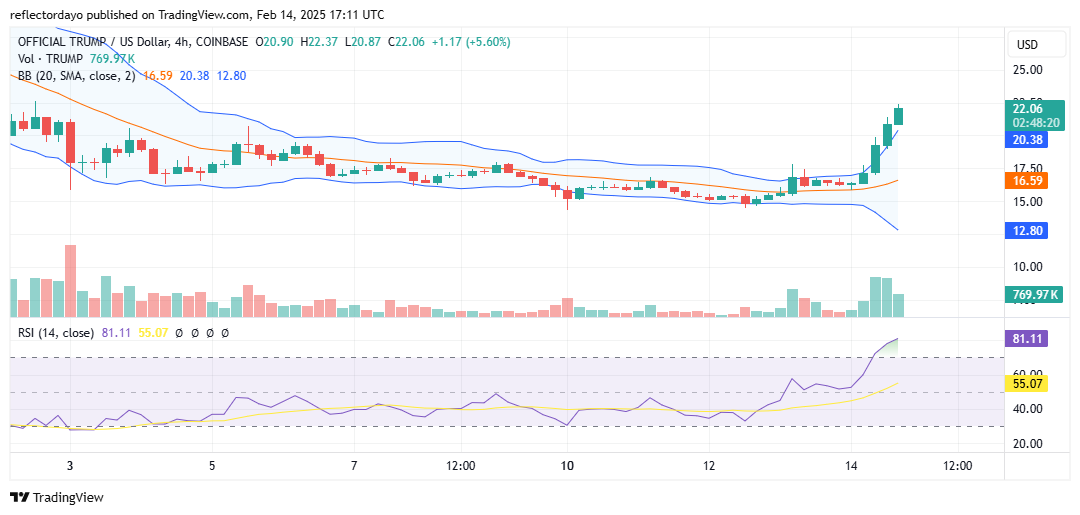
TRUMP/USD Price Prediction: 4-Hour Chart Analysis
The Official Trump market remains highly volatile, as evident on the 4-hour timeframe, where the current trend appears hyper-bullish. However, bullish exhaustion may set in unless the market establishes a higher support level around $20.
As the price nears $22, bearish sentiment is emerging, pushing back against the bullish momentum. Additionally, with the RSI not yet signaling oversold conditions, a potential pullback to the $20 level could provide a rebound opportunity for buyers.