Tellor (TRB/USD) Stabilizes Around $31, Signaling a Potential End to Bearish Trend
Estimated Reading Time: 3 minutes
Don’t invest unless you’re prepared to lose all the money you invest. This is a high-risk investment and you are unlikely to be protected if something goes wrong. Take 2 minutes to learn more
The Tellor (TRB) market has been in a prolonged bearish trend, consistently forming lower highs and lower lows as selling pressure drives the price downward. This bearish momentum began in December last year, following a consolidation phase, and was triggered by a strong sell-off from the $67 price level.
On the day the downtrend intensified, the bearish pressure at the critical $60 resistance level overwhelmed bullish sentiment, forcing buyers to surrender control. As a result, the market experienced significant downward momentum, breaking through multiple key support levels with ease.
Tellor Market Data
- TRB/USD Price Now: $37.9
- TRB/USD Market Cap: $100.46 million
- TRB/USD Circulating Supply: 2.6 million TRB
- TRB/USD Total Supply: 2.7 million TRB
- TRB/USD CoinMarketCap Ranking: #387
Key Levels
- Resistance: $40.00, $45.00, and $50.00
- Support: $35.00, $30.00, and $25.00.
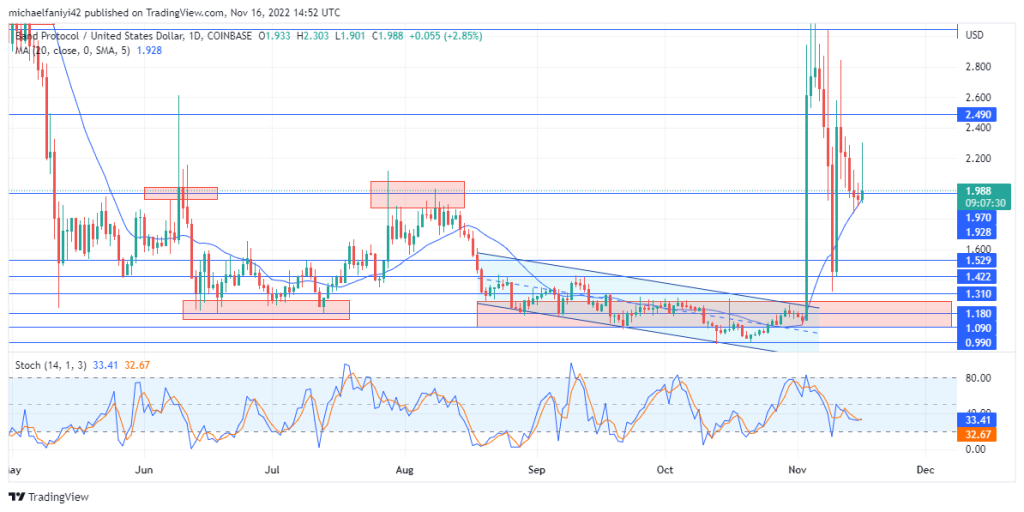
The Tellor Market Through the Lens of Indicators
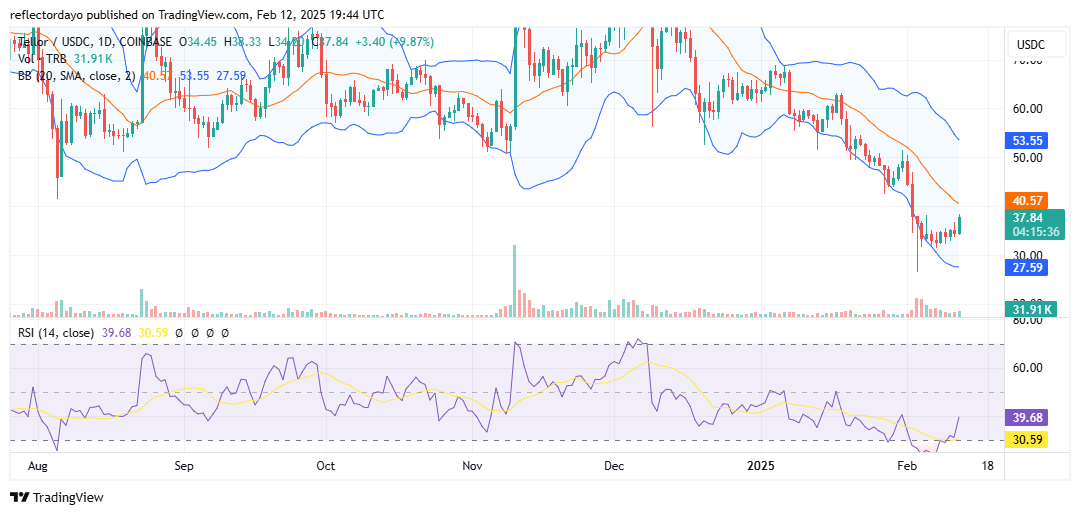
The Tellor (TRB) market continued its sharp decline until it found pivotal support at the $30 price level on February 3, which sparked a rally. At this low price, the market became attractive to investors and traders, leading to increased buying activity.
Initially, the growing bullish sentiment had to contend with lingering bearish pressure, resulting in a consolidation phase around $31. However, it now appears that the bearish influence is fading and bulls are gaining control.
Today’s crypto signal is marked by a strong recovery, and despite the presence of an upper shadow on the bullish candlestick, the market still holds the potential for further upward movement. Bulls may capitalize on the current high volatility to drive a substantial price rebound.
Additionally, the Relative Strength Index (RSI) indicates that bearish momentum is weakening as bullish activity increases, further supporting the possibility of a continued price surge.
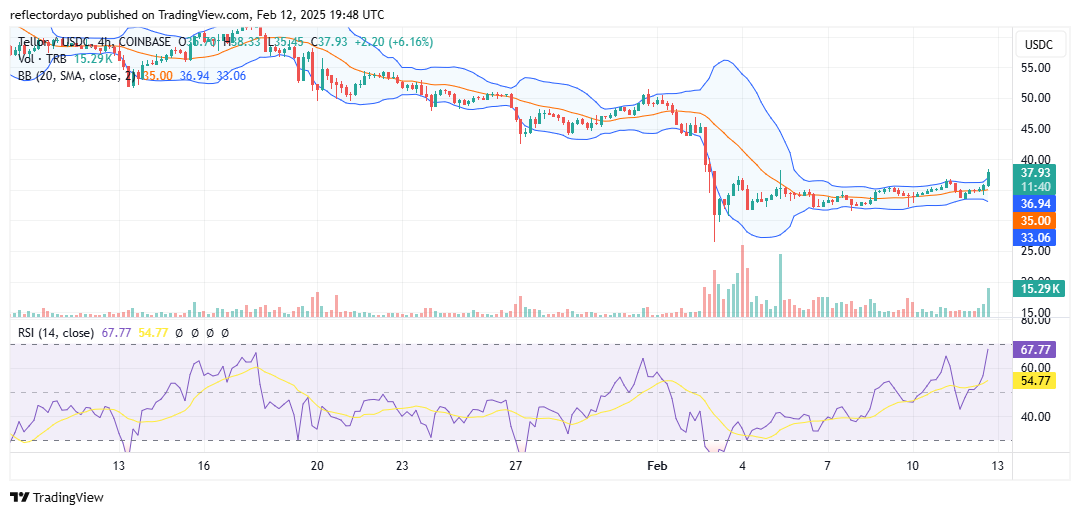
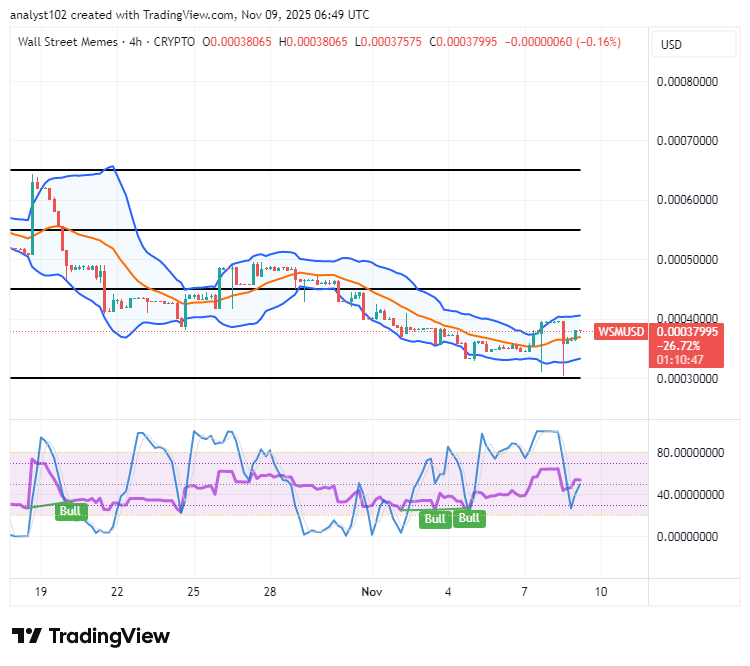
TRB/USD Price Prediction: 4-Hour Chart Analysis
From a 4-hour chart perspective, the Tellor (TRB) market remains in a consolidation phase, though bulls are now testing the resistance level. This could explain the upper shadow on the recent candlestick, indicating attempts to push higher despite lingering selling pressure.
Given the current market momentum, the $40 price level may pose a significant resistance, potentially challenging the ongoing bullish rebound. How the market reacts in the next daily trading session will be crucial in determining its next directional movement.