Dogecoin (DOGE) Price Prediction: DOGE/USDT Retreats Below $0.400 Level
Estimated Reading Time: 3 minutes
Don’t invest unless you’re prepared to lose all the money you invest. This is a high-risk investment and you are unlikely to be protected if something goes wrong. Take 2 minutes to learn more
Dogecoin (DOGE) Price Prediction (January 20):
The Dogecoin market recently surged past two key technical price levels. Price action breached the $0.3500 mark and advanced through the $0.4000 resistance level. However, the token’s price has retraced and now stands just above the psychological $0.3500 level.
DOGE/USDT Long-Term Trend: Bearish (Daily Chart)
Key Price Levels:
Resistance: $0.4000, $0.4500, $0.5000
Support: $0.3500, $0.3000, $0.2500
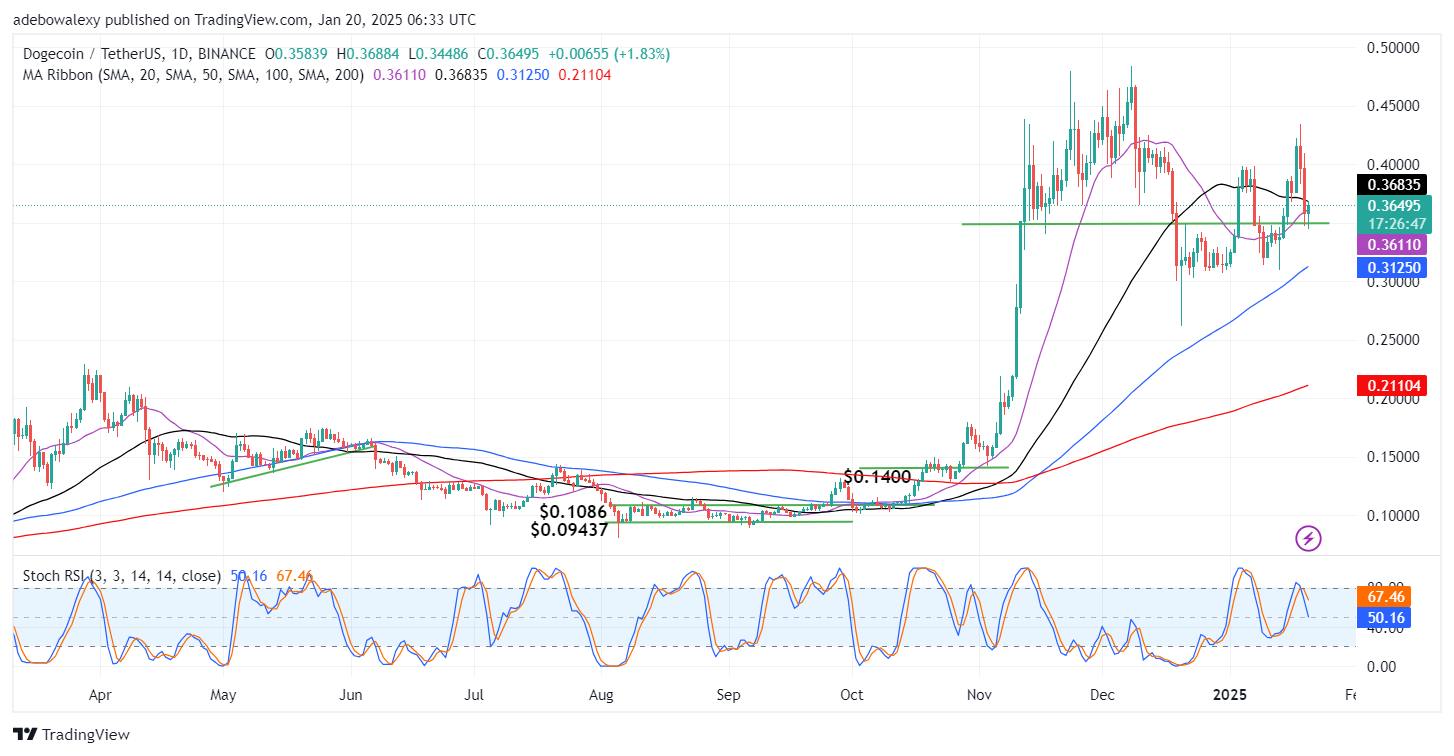
As of this writing, the ongoing session has printed minimal gains. Nevertheless, the corresponding price candle is positioned above the $0.3500 threshold. Additionally, the token is trading above the 20-, 100-, and 200-day Moving Average (MA) lines. However, the Stochastic Relative Strength Index (RSI) lines are still descending into the oversold region, indicating lingering bearish sentiment.
Dogecoin (DOGE) Price Prediction: DOGE/USDT Retains Bullish Potential
Price action in the Dogecoin market recently dropped sharply to medium-term support at the $0.3500 level. This support held firm, prompting a minor upward retracement. As a result, the current price of the token now lies above three of the four Moving Average (MA) lines on the chart. Notably, the 50-day MA line is approaching the close of the most recent price candle, along with the 20-day MA.
This indicates that these two MA lines may soon converge below the token’s current price, a development that would strengthen bullish momentum by boosting buyer confidence. Meanwhile, the Stochastic RSI lines remain downward-facing, with the lead line at the 50-threshold level, suggesting the market is in a transitional phase.
Dogecoin (DOGE) Price Prediction: DOGE/USDT Bulls Aim to Extend Dominance (4-Hour Chart)
On the Dogecoin daily chart, price action has rebounded off the $0.3500 baseline. The 4-hour chart further reveals that bullish forces are gaining traction in the new session. The most recent price candle remains green, albeit slightly contracted, and has lifted the token above the 100-day MA line.
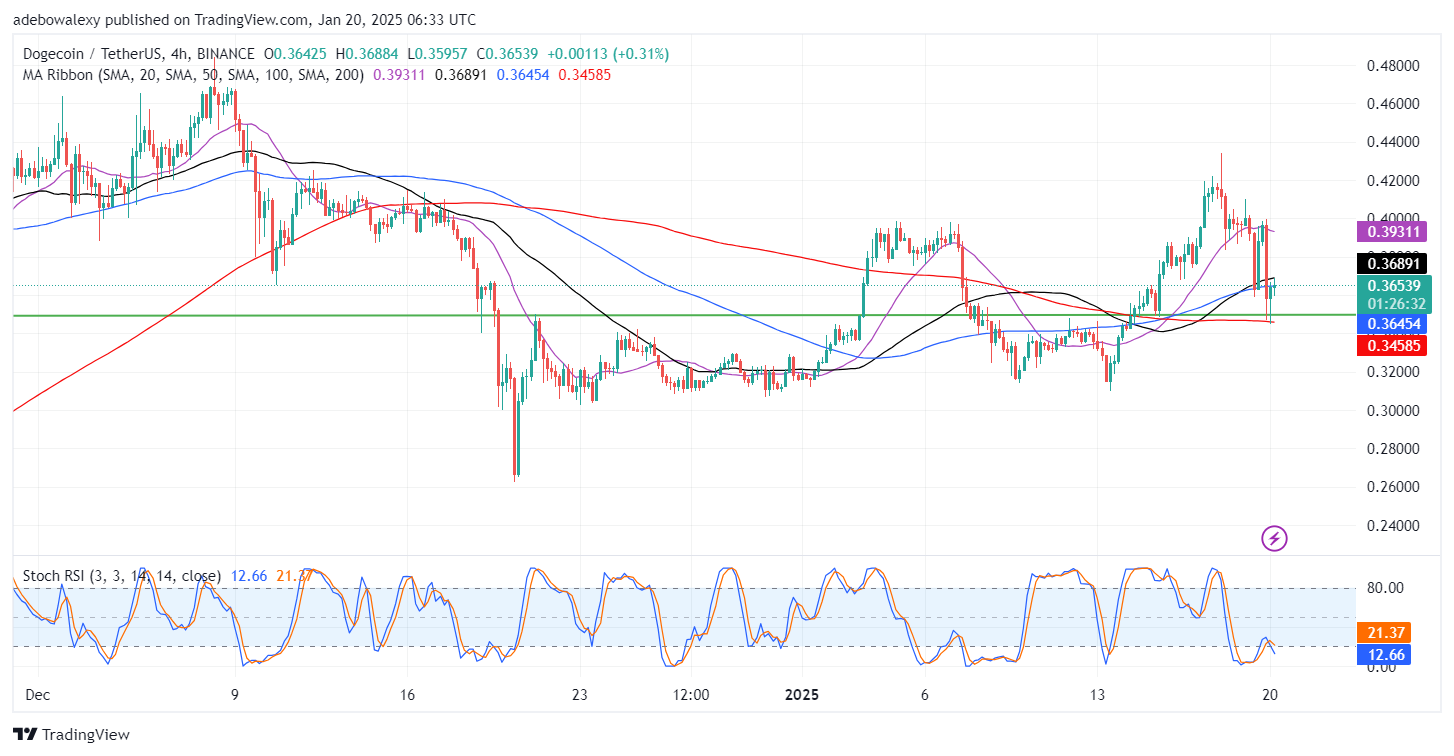
Moreover, the ongoing session is holding above the $0.3600 level, even as the Stochastic RSI lines continue to descend toward the oversold region. Although the current session places the token’s price between two MA lines, traders might maintain a bullish outlook due to the potential arrival of favorable catalysts in the broader crypto market. As a result, prices could soon reach the $0.4000 resistance level.