Polkadot (DOT) Makes an Impressive Bullish Run but Faces Rejection at $53
Estimated Reading Time: 2 minutes
Don’t invest unless you’re prepared to lose all the money you invest. This is a high-risk investment and you are unlikely to be protected if something goes wrong. Take 2 minutes to learn more

Polkadot (DOT) Long-Term Analysis: Bullish
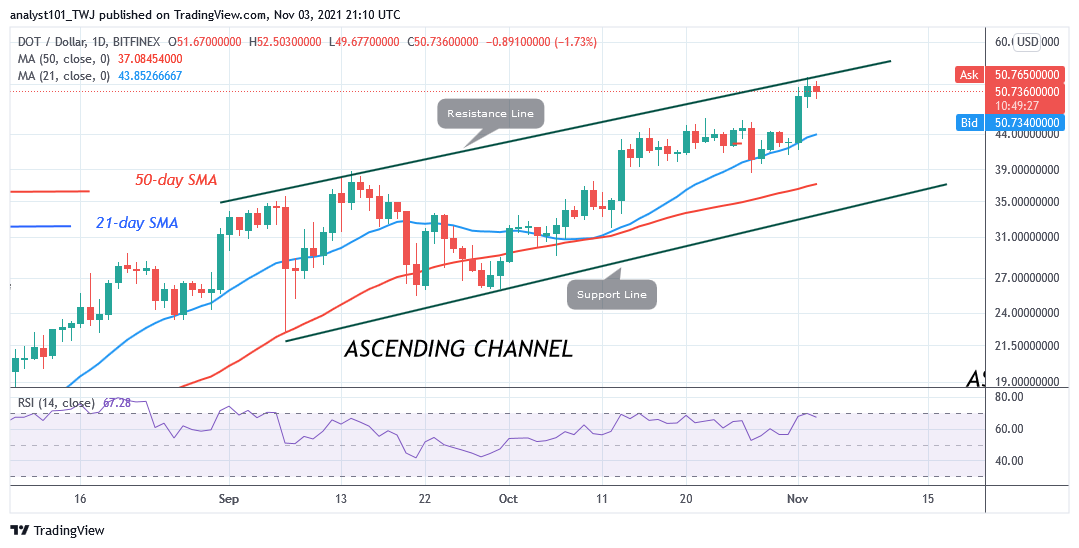
Yesterday, Polkadot’s (DOT) price rallied to $53 high. Today, cryptocurrency is facing resistance at the recent high. Before the recent breakout, the previous uptrend was stalled below the $46 high for two weeks. The bulls could not keep prices above the $46 high. Consequently, the altcoin dropped to $38 low and held above the current support. DOT price dropped above the 21-day line moving average. The altcoin rebounded above the 21-day Line moving average to reach the recent high. Presently, the altcoin is retracing as the market reaches the overbought region.
Polkadot (DOT) Indicator Analysis
DOT price has fallen to level 63 of the Relative Strength Index period 14. It is in the uptrend zone and above the centerline 50. The price bars are above moving averages as it points northward indicating the uptrend. DOT price is below the 80% range of the daily stochastic. The market is in a bearish momentum .
Technical indicators:
Major Resistance Levels – $48, $52, $56
Major Support Levels – $32, $28, $24
What Is the Next Direction for Polkadot (DOT)?
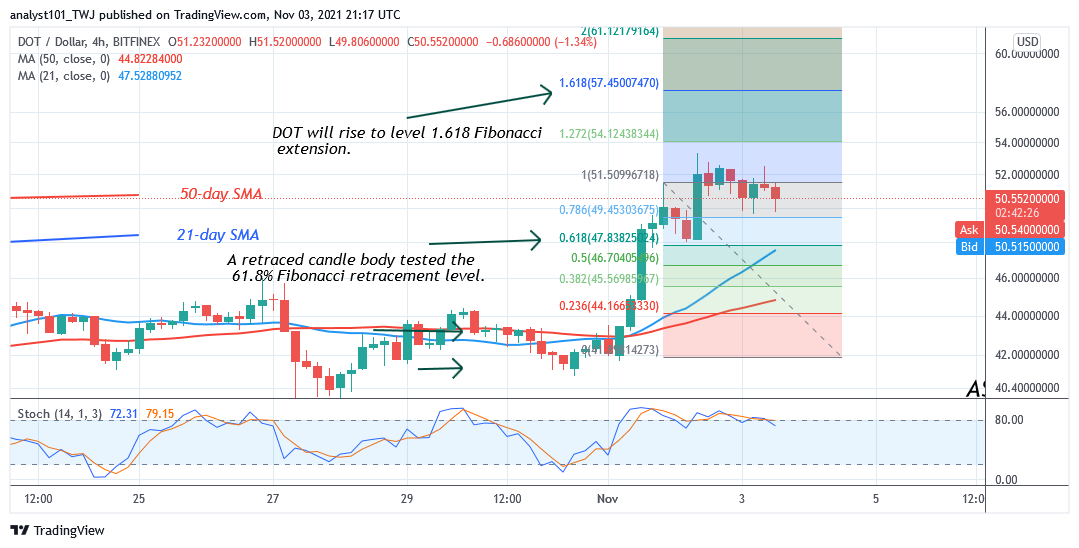
On the 4 –hour chart, Polkadot has rallied to the $53 high and to the overbought region. The market is retracing for possible upside momentum. Meanwhile, on the November 1 uptrend, a retraced candle body tested the 61.8% Fibonacci retracement level. The retracement indicates that DOT will rise to level 1.618 Fibonacci extension or $57.45.
You can purchase crypto coins here. Buy Tokens
Note: Cryptosignals.org is not a financial advisor. Do your research before investing your funds in any financial asset or presented product or event. We are not responsible for your investing results