Litecoin (LTC) Price Prediction: LTC/USDT Extends But Stays Above Key Levels
Estimated Reading Time: 3 minutes
Don’t invest unless you’re prepared to lose all the money you invest. This is a high-risk investment and you are unlikely to be protected if something goes wrong. Take 2 minutes to learn more
Litecoin (LTC) Price Prediction: July 30
Headwinds were moderately active in the previous session in the Litecoin daily market. This caused the market to contract downward and retreat below the $77.00 price level.
LTC/USDT Long-term Trend: Bearish (Daily Chart)
Key Price Levels:
Resistance Levels: $80.00, $90.00, and $100.00
Support Levels: $70.00, $60.00, and $50.00
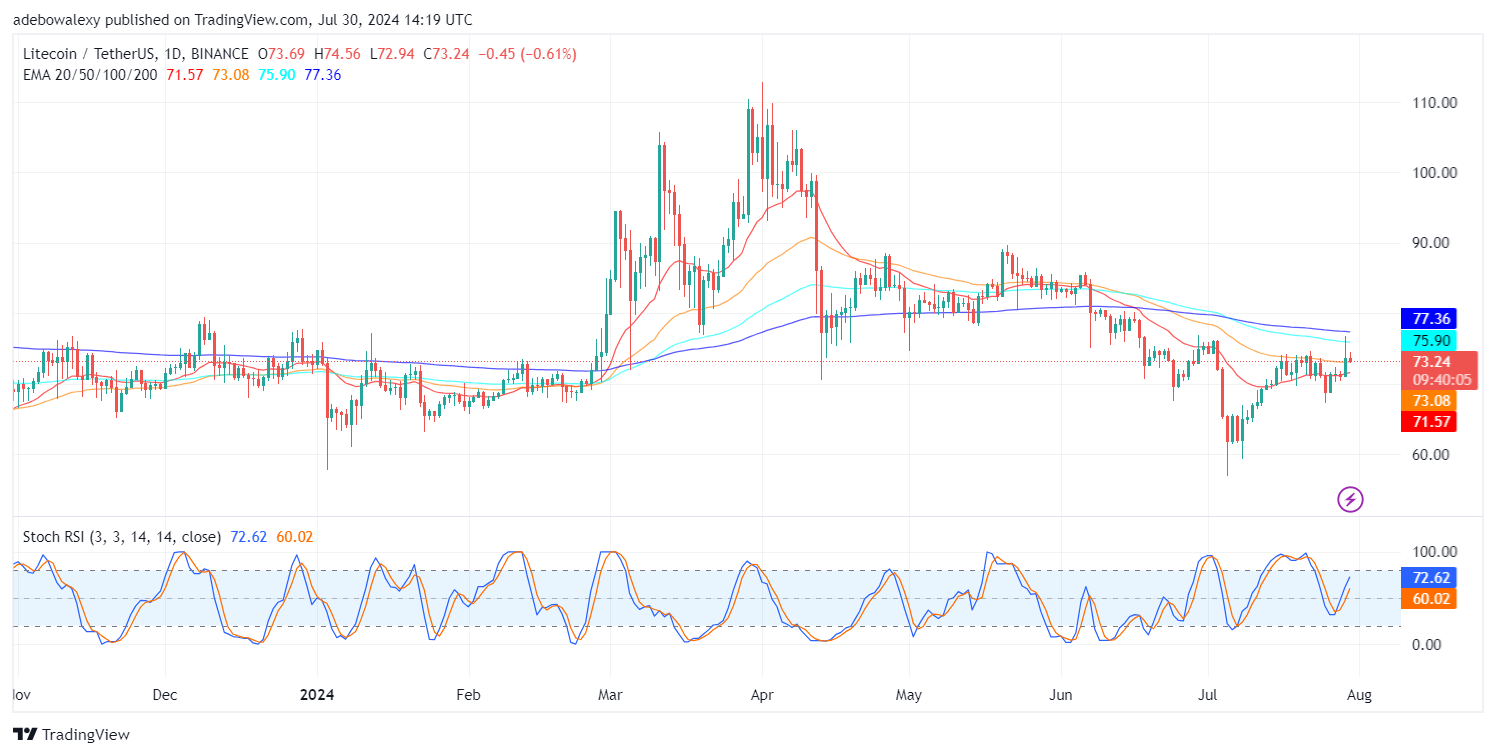
Nevertheless, the ongoing session has continued to trade above the 20- and 50-day Exponential Moving Average (EMA) lines. The current session has printed just an additional minor downward correction to the one seen in the previous session. Despite all the bearish activity, the Stochastic Relative Strength Index (SRSI) indicator sticks to an upside trajectory.
Litecoin Price Prediction: LTC/USDT May Pick Up Bullish Momentum
The LTC/USDT daily price chart reveals that downward forces have acted on price movement, causing the market to retreat toward lower levels. Nevertheless, price action stands just above the 20-day EMA curve, with Litecoin trading between the four EMA lines on this chart.
Meanwhile, the SRSI seems somewhat obstinate as its lines refuse to reflect downward pressure, maintaining an upward path. Technically, this hints that upside pressure may still cause the market to reclaim higher price levels soon.
LTC/USDT Medium-term Trend: Litecoin Downward Correction Cools (4H Chart)
In the Litecoin 4-hour market, price action has trickled down after surging past $75.00. Initially, the downward correction was stronger, but it soon cooled as the market fell below the $75.00 mark. The ongoing session shows a further decline in downward pressure.
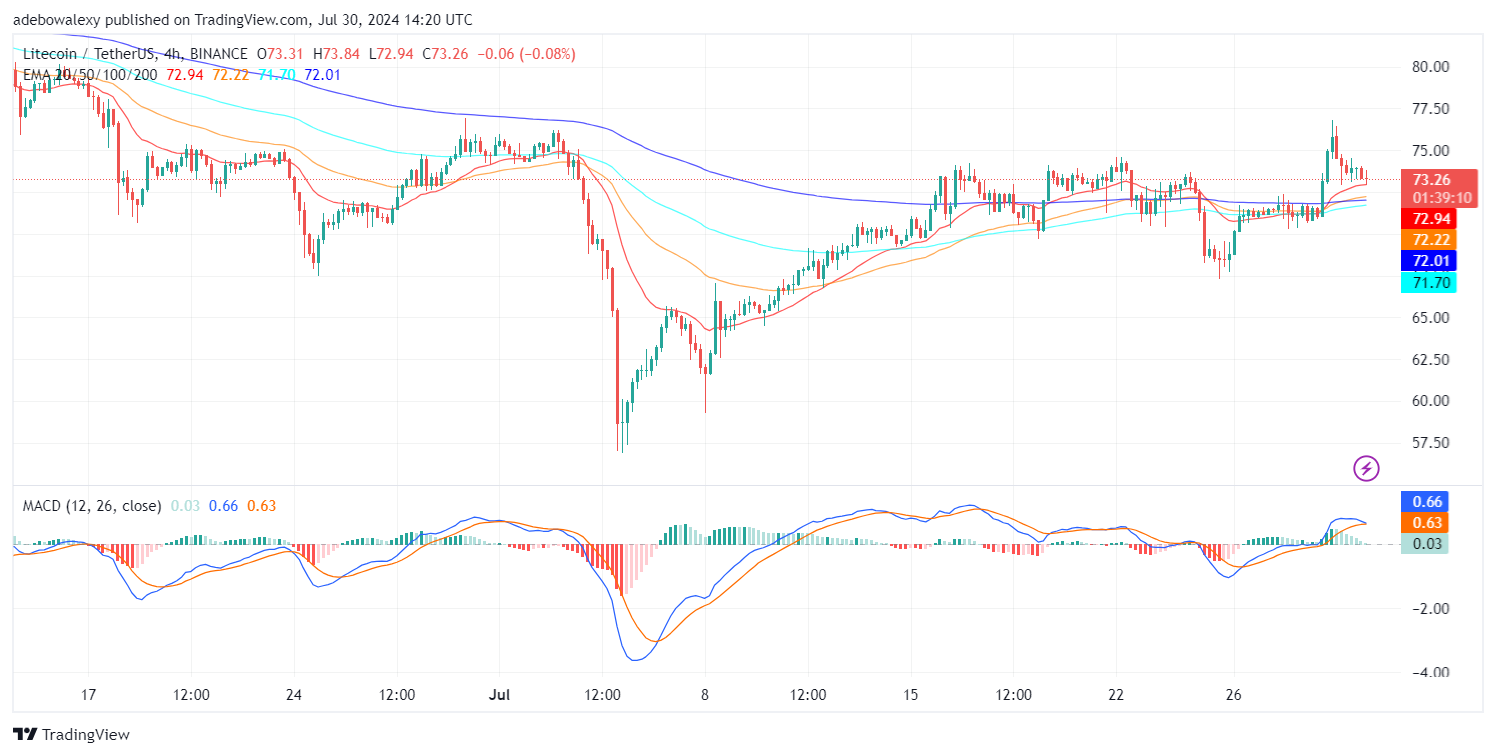
The coin still trades above the EMA lines, with downward forces leading by a very tiny fraction. Meanwhile, the Moving Average Convergence Divergence (MACD) lines are above the equilibrium level but have converged. A careful look at the terminal part of these lines reveals that a bearish crossover may be averted.
At this point, traders might want to anticipate a rebound towards the $75.00 or $80.00 mark. However, traders should take necessary precautions to keep any losses within their tolerance range..