Dogecoin (DOGE) Price Prediction: DOGE/USDT Escapes Gravitational Pull Below EMA Lines
Estimated Reading Time: 3 minutes
Don’t invest unless you’re prepared to lose all the money you invest. This is a high-risk investment and you are unlikely to be protected if something goes wrong. Take 2 minutes to learn more

Dogecoin (DOGE) Price Prediction: July 29
The DOGE/USDT daily market has had a general upside trajectory ever since it’s price action rebounded off the support constituted by the $0.1000 mark. In more recent sessions, price activity in this market have been oscillating between the $0.1300 mark and the $0.1400 mark.
DOGE/USDT Long-term Trend: Bullish (Daily Chart)
Key Price Levels:
Resistance Levels: $0.1500, $0.1600, and $0.1700
Support Levels: $0.1300, $0.1200, and $0.1100
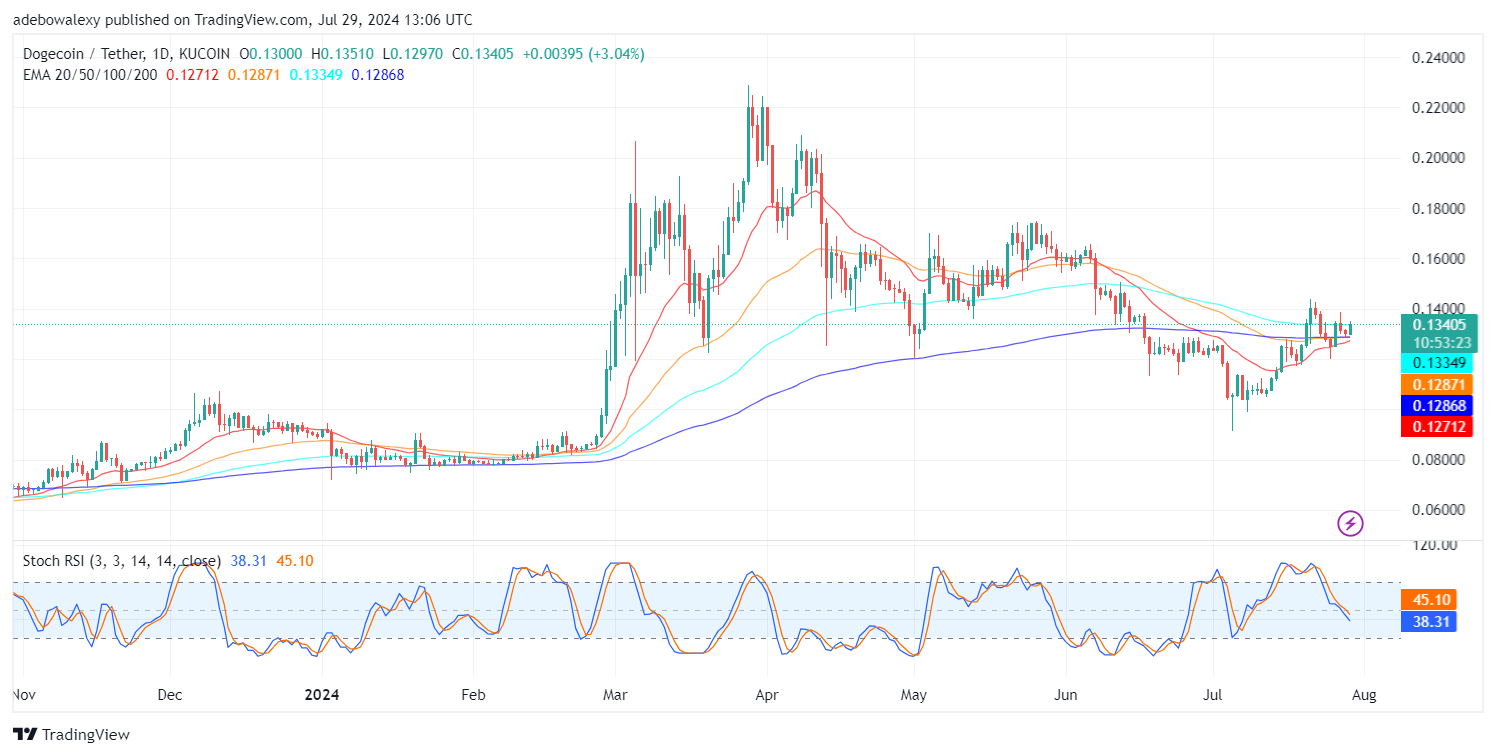
Today’s trading has brought the Dogecoin market to traders above all the Exponential Moving Average (EMA) lines by a thin margin. The corresponding price candle to the ongoing session can be seen appearing conspicuous and green in color, standing above the 20, 50, and 100-EMA lines. Meanwhile, the Stochastic Relative Strength Index (SRSI) lines are still trending downwards below the 50 level of the indicator.
Dogecoin Price Prediction: The DOGE/USDT Market Has Picked an Upward Path
Although technical indicators are divergent at this point in the Dogecoin market, it can be seen that the ongoing session has taken an upward path. Price action has already crossed above all the EMA lines. Additionally, the ongoing session is witnessing a noticeable amount of upside push.
This is revealed through the size and color of the candle representing the price. However, the SRSI lines can be seen still maintaining a bearish path, which may be due to the indicator lagging. Nevertheless, traders may eventually draw more bullish conclusions about this market since the coin currently trades above all the EMA curves.
DOGE/USDT Medium-term Trend: Dogecoin Keeps Showing Bullish Potentials (4H Chart)
Price activity in the Dogecoin market in the 4-hour time frame appears to be standing above all the EMA lines. Furthermore, the last price candle can be seen standing at a distance above all the EMA lines while appearing solid green. The SRSI, however, can be seen as having a general upward trajectory but a deflection in its leading line. Be that as it may, the lines of this indicator can be seen now arriving above the 50-level indicator.
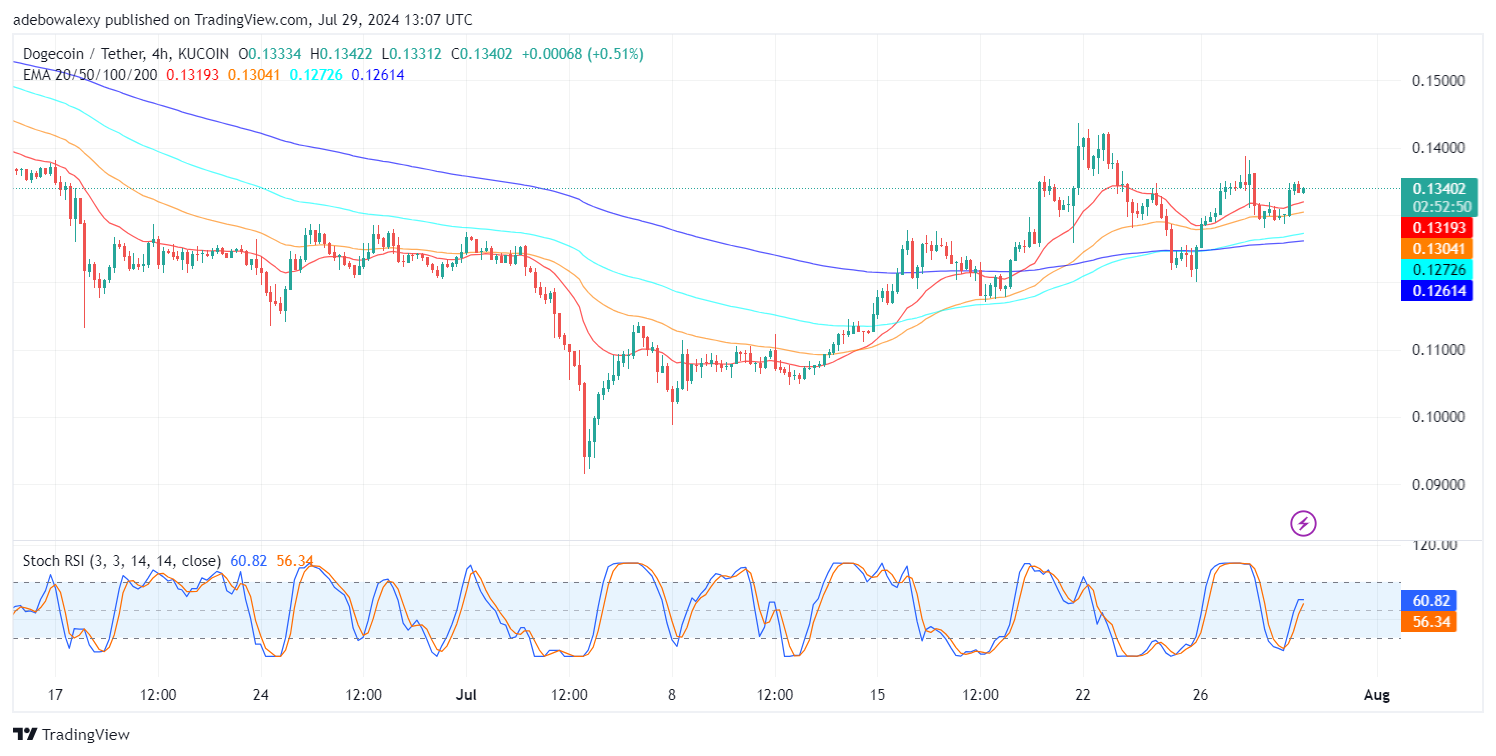
Technically, the upside correction seems challenged, yet this market still is on an upward path. The appearance of the last price candle signals that upside forces may still be active in this market. Therefore, despite the deflection, traders can aim around the $0.1400 price level for short-term gains.