Bitcoin (BTC/USD) Market Retraces at a Higher Rate
Estimated Reading Time: 3 minutes
Don’t invest unless you’re prepared to lose all the money you invest. This is a high-risk investment and you are unlikely to be protected if something goes wrong. Take 2 minutes to learn more
Bitcoin Price Prediction – October 27
It observed that the BTC/USD market retraces at a higher rate, having broken the critical level at $60,000. The crypto market worth trades around $59,220 at a negative percentage rate of about 2.67.
BTC/USD Market
Key Levels:
Resistance levels: $65,000, $67,500, $70,000
Support levels: $57,500, $55,000, $52,500
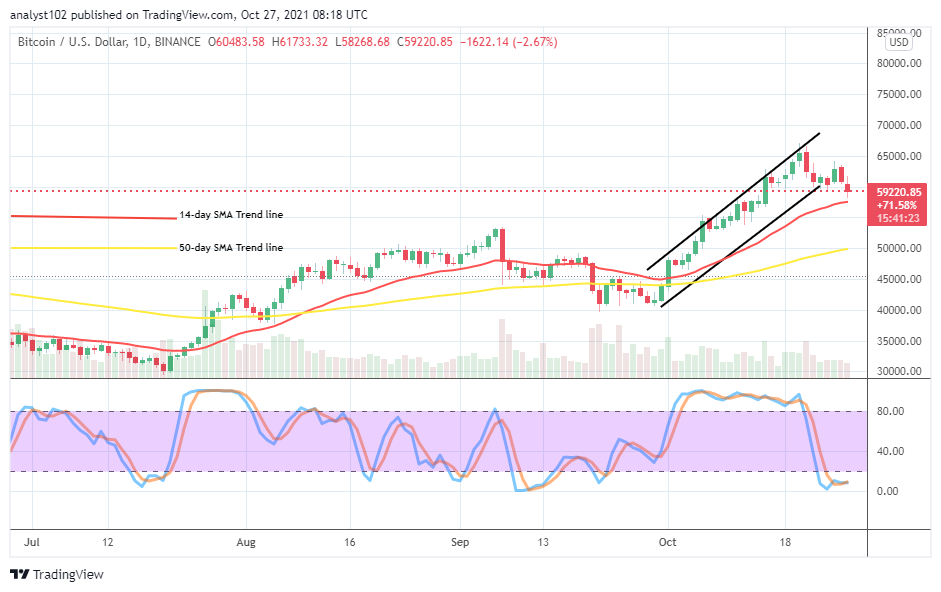
BTC/USD – Daily Chart
The BTC/USD daily chart showcases that the crypto market retraces at a higher rate against the critical level at $60,000, pushing southward closely to the smaller SMA trend line. The 50-day SMA indicator is beneath the 14-day SMA indicator. That indicates that the pressures to the downside still needed to focus on by traders. The Stochastic Oscillators are in the oversold region with the lines closed, seemingly trying to begin a consolidation movement in it.
What could be the expectation of traders if price consolidates beneath $60,000 as the market retraces at a higher pace, breaking the value-line?
A consolidation of the BTC/USD price valuation beneath the $60,000 level as the crypto market retraces at a higher rate, breaking the value-line, may, in the long run, lead to potential free-falls afterward. However, some intrigues of buy signals may feature at variant lower systemic-trading lines between the SMAs. Long position takers needed to exercise some precautionary trading techniques.
On the downside, the BTC/USD market bears should now have to consolidate their stances by capitalizing on the current depression forces to fearfully breach the 14-day SMA indicator to the downside. The presence of the Stochastic Oscillators in the oversold region raises the suggestion that short position takers needed as well to be wary of their order executions.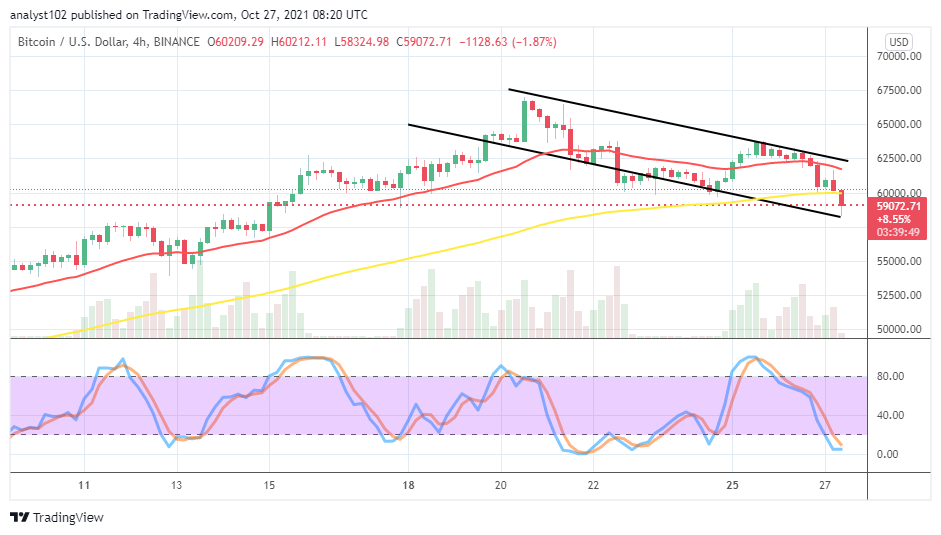
BTC/USD 4-hour Chart
The BTC/USD 4-hour chart reveals that the crypto market retraces at a higher rate, breaking past the 50-day SMA trend line at $60,000 or ice level. The 14-day SMA indicator is above the 50-day SMA indicator. And, they have both lightly bent to the south. The Stochastic Oscillators are in the oversold region, attempting to close the lines within. That suggests that the correction motion may soon witness some senses of relaxation. Presently, the market support level at $57,500 will have to serve as the new pivotal value-line.
Note: Cryptosignals.org is not a financial advisor. Do your research before investing your funds in any financial asset or presented product or event. We are not responsible for your investing results.
You can purchase crypto coins here. Buy Tokens