Litecoin (LTC/USD) Price Attempts Sitting at $100
Estimated Reading Time: 3 minutes
Don’t invest unless you’re prepared to lose all the money you invest. This is a high-risk investment and you are unlikely to be protected if something goes wrong. Take 2 minutes to learn more
Litecoin Price Prediction – January 25
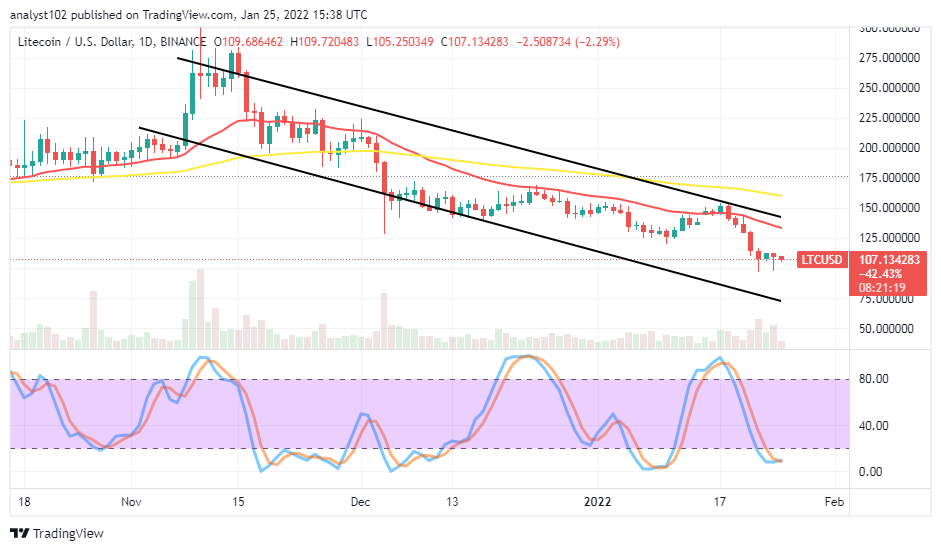
There has been a line of efforts being made by the LTC/USD market, somewhat featuring in a range style as the crypto-economic price attempts sitting at $100. The crypto versus the US economy’s financial book records a higher value of about $109 and a lower point of about $105 to maintain a negative percentage rate of about 2.29.
LTC/USD Market
Key Levels:
Resistance levels: $125, $145, $165
Support levels: $100, $80, $60
LTC/USD – Monthly Chart
The LTC/USD daily chart showcases the crypto-economic price attempts sitting at $100. The upper bearish trend line drew downward a bit over the smaller SMA. The 50-day SMA indicator is above the 14-day SMA indicator. The Stochastic Oscillators are in the oversold region with their lines closed within. It indicated currently that the crypto economy is pausing its operations to the downside for a while.
Will there still be downward motions in the LTC/USD market as the crypto-economic price attempts sit at $100?
Considering the technical readings of the Stochastic Oscillators, showcasing the LTC/USD market trading at one of the notable lower spots, the trade may not be slipping in free fall-offs afterward as price attempts sitting at $100 level. The market tends to resume a necessary rallying motion that may run into several days’ sessions. In the long run of the market making a successful northward move in that process, the price will have to encounter resistance around $125. Therefore, exerting more buying orders at that level should suspend.
On the downside of the technical analysis, the LTC/USD market short-position takers needed to allow price pulling up to garner some momentums at a higher spot of around $125 and be on the lookout for a return of upward reversal trading signal pattern before deciding to launch a sell order. A sudden hike against the value line may in no time give birth to rejections at a higher close spot that can result in a reversal trading outlook that sellers can rely on for a safe sell entry.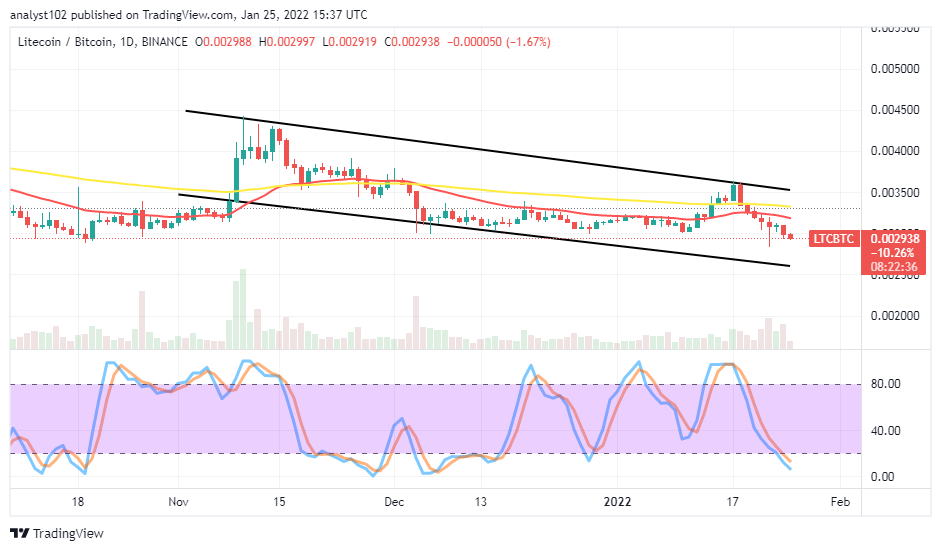
LTC/BTC Price Analysis
In comparison, Litecoin’s pushing capacity remains under falling forces as placed against Bitcoin. The price analysis chart shows the cryptocurrency pair price attempts moving further southward in the bearish channel trend lines. The 14-day SMA indicator is closely beneath the 50-day SMA indicator. The Stochastic Oscillators have moved into the oversold region, relatively pointing to the downside direction within it. That indicates the base crypto still succumbs to a depression inflicted on it by the flagship counter crypto.
Note: Cryptosignals.org is not a financial advisor. Do your research before investing your funds in any financial asset or presented product or event. We are not responsible for your investing results.
You can purchase crypto coins here. Buy Tokens