The Graph Bulls Determined to Take the $0.15 Price Level
Estimated Reading Time: 2 minutes
Don’t invest unless you’re prepared to lose all the money you invest. This is a high-risk investment and you are unlikely to be protected if something goes wrong. Take 2 minutes to learn more
The $0.15 price level has been a major price level. The price action has continued to oscillate along this very price line for quite a while. The Graph market has maintained the $0.15 price level as its equilibrium since the second half of February. The bullish price has broken this level several times, but the bulls could not sustain the market above it. The latest support level is the $0.14 price level. It seems like a strong one as it still holds after the bullish price was rejected again above $0.15.
GRT/USD Price Statistics
- GRT/USD Price Now: $0.155
- GRT/USD Market Cap: $1,365,595,101
- GRT/USD Circulating Supply: 8,882,779,093 GRT
- GRT/USD Total Supply: 10,612,569,063
- GRT/USD CoinMarketCap Rank: #42
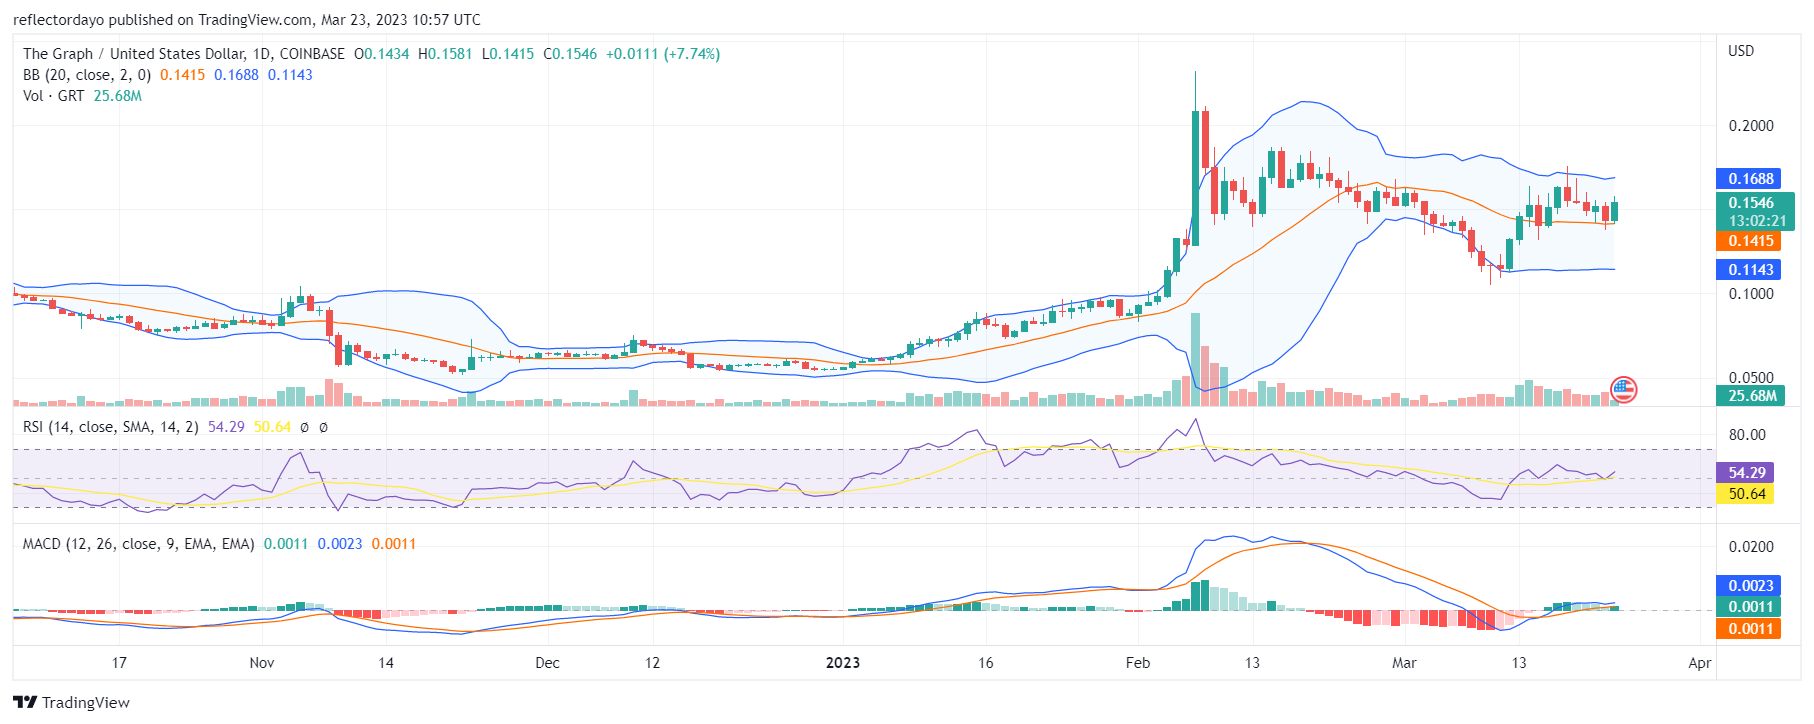
Key Levels
- Resistance: $0.160, $0.170, and $0.180
- Support: $0.120, $0.110, and $0.120
Price Prediction for the Graph: The Indicators’ Point of View—Bulls Back for More
The bull market is bouncing back from the $0.14 price level, which is the latest support level. The higher support of the $0.14 price level is ideal for the capture of the key resistance price level, which is $0.164. If the bull market can reach this price level before the daily session runs out, the market will maintain a considerable amount of volatility. However, if the market keeps moving around this level, the market will consolidate, and then, after the price consolidation, we will see another decisive price breakout in the market. According to the indicators, the bull market is advancing toward its mark.
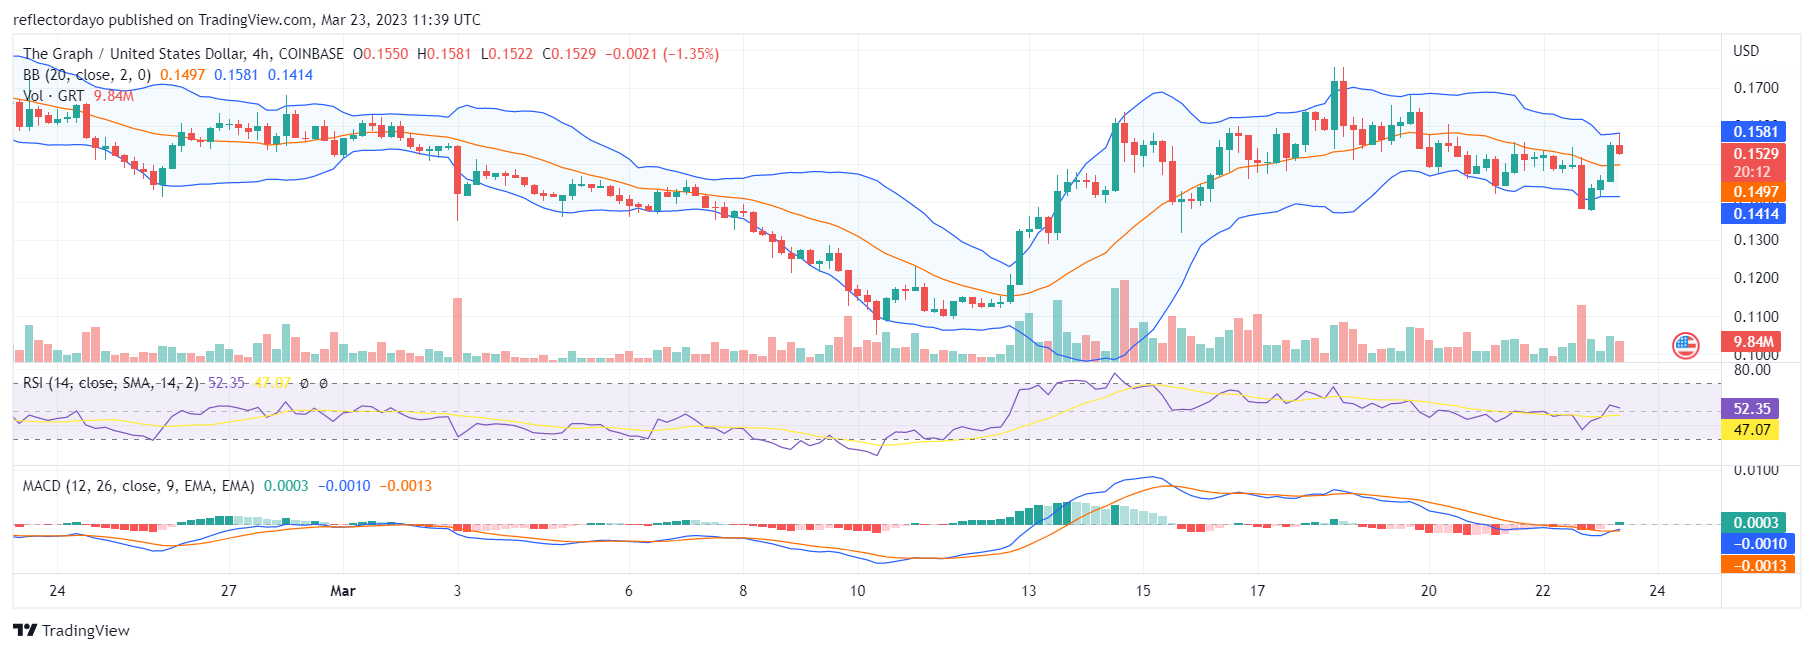
GRT/USD 4-Hour Chart Outlook
From the 4-hour chart, we noticed that a strong resistance level has formed around the $0.156 price level. The bull market has been turned down several times at this level, and yet again, it seems like that is about to happen again. The bulls pushed the market to that level with their massive buying. They even tested the $0.159 price level, but this bullish price was rejected. The bull market now struggles at around $0.156. If this price level can be taken in this 4-hour trading session, then the bulls may have a chance at the $0.156 price mark in the daily session.