Chainlink (LINK) falls and Revisits $24 Low, an Upward Move Likely
Estimated Reading Time: 2 minutes
Don’t invest unless you’re prepared to lose all the money you invest. This is a high-risk investment and you are unlikely to be protected if something goes wrong. Take 2 minutes to learn more
Chainlink (LINK) Long-Term Analysis: Bullish
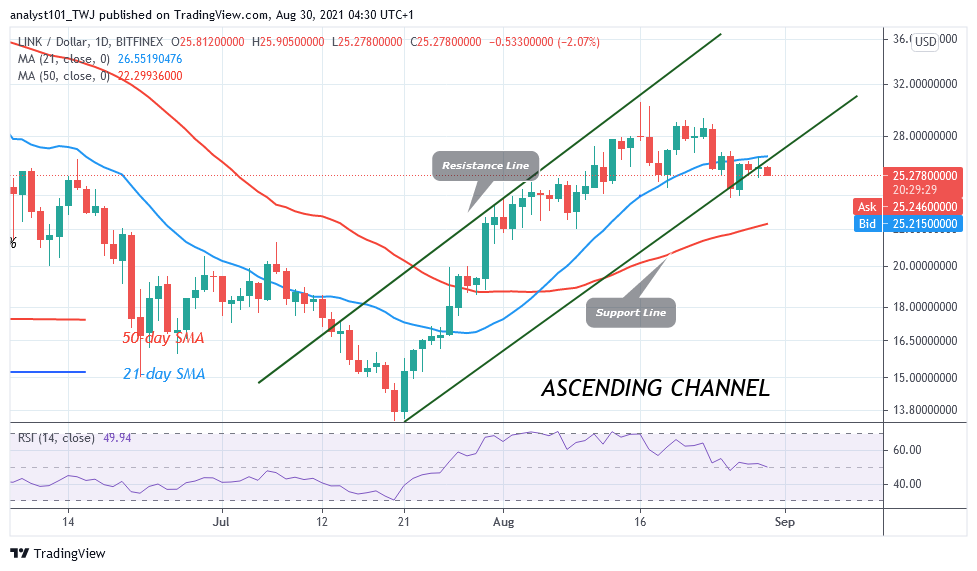
Chainlink (LINK) price corrected upward to $26 high but was resisted. The bulls could not break above the $26 high because of selling pressure. However, after four days of downward correction, Chainlink is falling. Today, LINK/USD is falling and has reached a low of $25.25. The current fall might reach the previous low of $24.30.On the downside, if the bears break below the $24.30 low, the market will decline to $22 low. In the same vein, the uptrend will resume, if LINK falls and finds support above $24.30.
Chainlink (LINK) Indicator Analysis
LINK price has fallen to level 49 of the Relative Strength Index period 14. It indicates that there is a balance between supply and demand. The coin is falling and revisiting the previous low at $24.30. Chainlink is in a bearish momentum and below the 50% range of the daily stochastic.
Technical indicators:
Major Resistance Levels – $60, $62, $ 64
Major Support Levels – $30, $28, $26
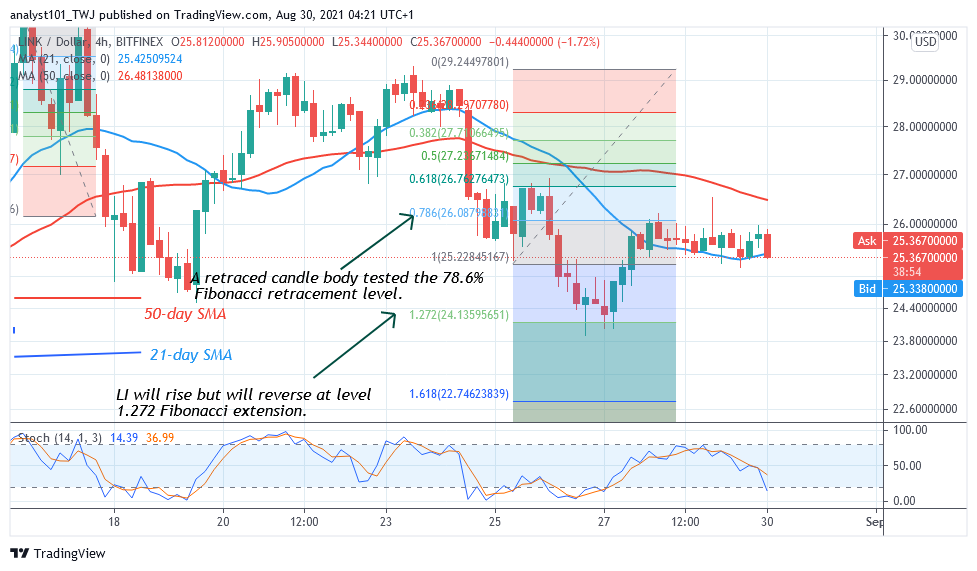
What Is the Next Direction for Chainlink (LINK)?
Chainlink is in a downward maove as it breaks below the 21-day SMA. The Fibonacci tool has indicated a possible decline of crypto. Meanwhile, on August 25 downtrend; a retraced candle body tested the 78.6% Fibonacci retracement level. This retracement indicates that the market will fall to level 1.272 Fibonacci extensions or level $24.15 and reverse.
You can purchase crypto coins here. Buy Tokens
Note: Cryptosignals.org is not a financial advisor. Do your research before investing your funds in any financial asset or presented product or event. We are not responsible for your investing resul