Solana (SOL) Price Prediction: SOL/USDT Hangs Above $220 by a Whisker
Estimated Reading Time: 3 minutes
Don’t invest unless you’re prepared to lose all the money you invest. This is a high-risk investment and you are unlikely to be protected if something goes wrong. Take 2 minutes to learn more

Date: October 17, 2025
The Solana market has continued to spiral downward after the token’s bullish momentum peaked at the $250 price level in September. Since then, the market has been forming lower highs as it gradually moves toward lower support zones.
Long-Term Trend — Bearish (Daily Chart)
Key Price Levels:
Resistance: $195, $205, $215
Support: $185, $175, $165
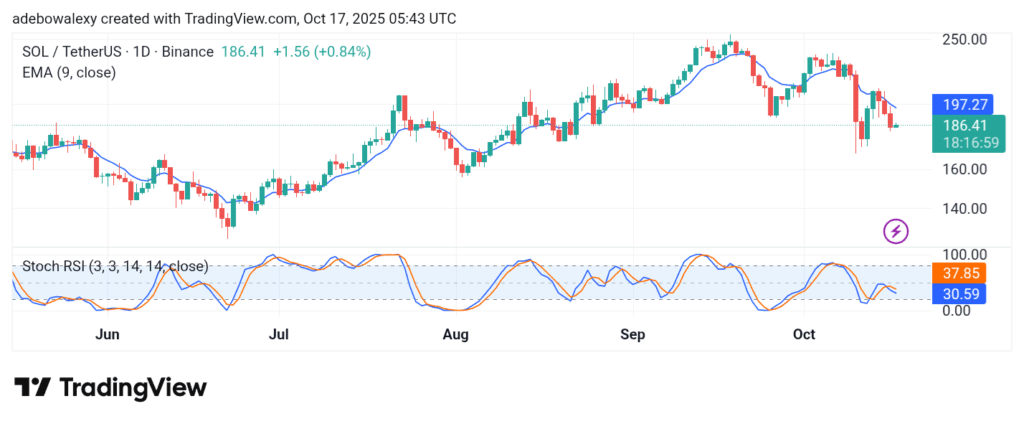
Price movement on the Solana daily chart recently rebounded downward off the 9-day Exponential Moving Average (EMA) line, which now acts as resistance. This rejection occurred three sessions ago, and the market has since continued its steep decline.
The latest price candle appears green, yet it remains below the 9-day EMA curve, reflecting weak bullish momentum. Meanwhile, the Stochastic Relative Strength Index (SRSI) indicator has just performed a downward crossover around the 50 level, and its lines are now proceeding further downward — signaling a strengthening bearish trend.
Solana (SOL) Price Prediction: Bears Maintain a Strong Presence
Price activity on the Solana daily chart indicates that downward forces remain dominant. The last green candle is relatively small and appears well below the 9-day EMA curve, suggesting limited buying pressure.
At the same time, the SRSI lines have made a smooth U-turn from the 50 threshold, keeping the indicator’s curves near the oversold region. This behavior highlights the persistence of bearish control. The ongoing decline, which has lasted for three consecutive sessions, has overwhelmed the modest buying seen so far—further confirming that sellers maintain the upper hand.
Solana (SOL) Price Prediction: SOL/USDT Bears Stay Firmly in Control (4-Hour Chart)
Even on shorter timeframes, bearish sentiment continues to dominate. Price action remains below the 9-day EMA curve. Notably, the session preceding the current one formed a small green candle, but the ongoing session has turned red, suggesting renewed selling pressure.
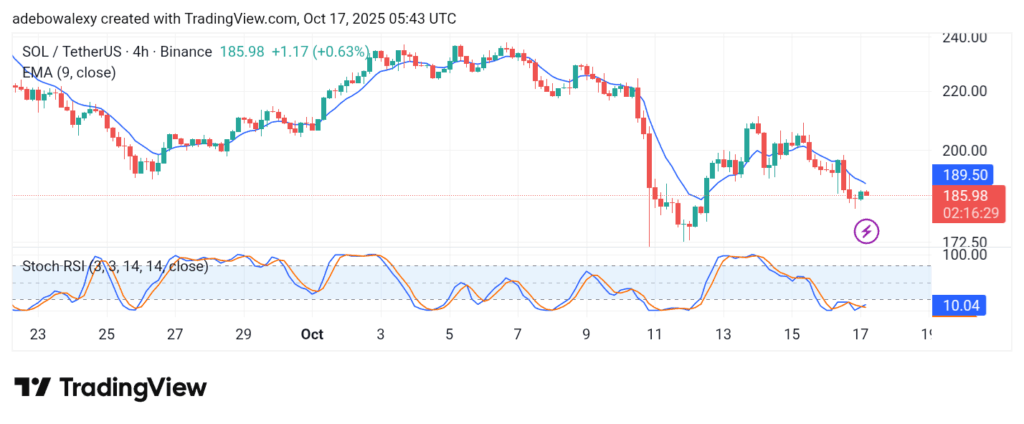
The SRSI indicator recently produced an upward crossover within the oversold region, hinting at a possible short-term recovery. However, given the current bearish momentum, this signal appears weak. Bullish sentiment remains under pressure, and price action may continue to descend toward the $180 support level in the near term.