Wall Street Memes (WSM) Price Steady Now, Rebound Likely
Estimated Reading Time: 4 minutes
Don’t invest unless you’re prepared to lose all the money you invest. This is a high-risk investment and you are unlikely to be protected if something goes wrong. Take 2 minutes to learn more
Wall Street Memes Price Prediction – November 21
A sequence of mild pullbacks repeatedly held above short-term demand zones, showing WSM/USD market buyers are still active despite reduced volatility. Gradually improving momentum readings signaled strengthening bullish interest, creating conditions that made a near-term rebound increasingly likely.
Momentum indicators gradually shifted upward, revealing renewed strength beneath the surface. With sell pressure steadily weakening and demand reclaiming influence, WSM/USD trade conditions increasingly pointed toward an upcoming rebound phase.
WSM/USD Market
Key Levels
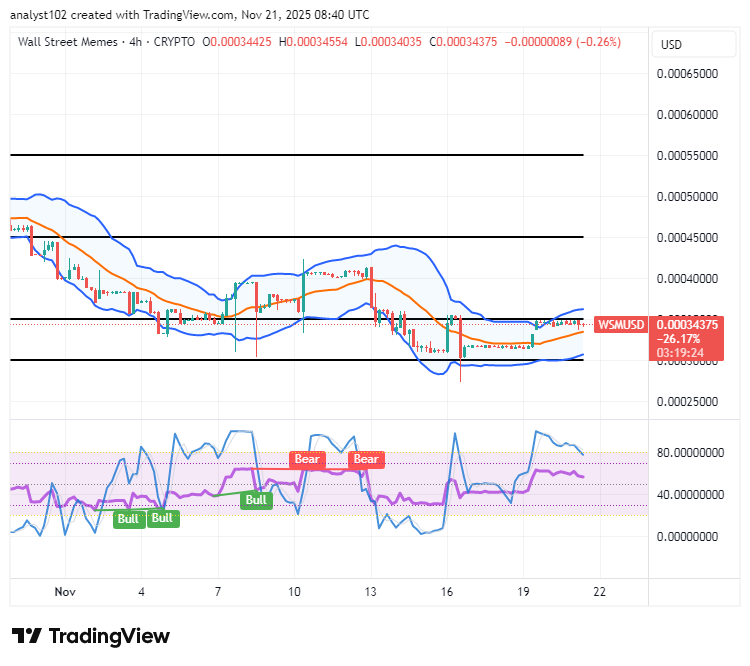
Resistance levels: $0.0004, $0.00045, $0.0005
Support levels: $0.0003, $0.00025, $0.0002
WSM/USD – 4-hour Chart
On the medium-term chart, the WSM/USD trade is steady now, setting the stage for a potential rebound.
The Bollinger Bands are being consistently tapped along their upper section, clearly signaling that upward market pressure is steadily building with greater persistence. The Stochastic Oscillators are climbing in a controlled upward rise, indicating that long-term holding positions are forming as trader confidence strengthens noticeably.
Can WSM Maintain Its Current Stability as Momentum Builds Toward a Potential Rebound Phase Ahead?
The market’s stability suggests buyers are gradually reclaiming influence as short-term demand zones continue to hold firm. Strengthening momentum indicators point to improving sentiment, and if trading volume increases in alignment, WSM/USD trade could advance into a clearer rebound phase over the coming sessions.
In addition, the gradual reduction in selling pressure suggests that bears are losing their grip, allowing accumulation to build quietly beneath the surface. If these supportive conditions continue, WSM could establish a clearer recovery path, drawing in renewed speculative interest and strengthening the chances of a sustained rebound phase.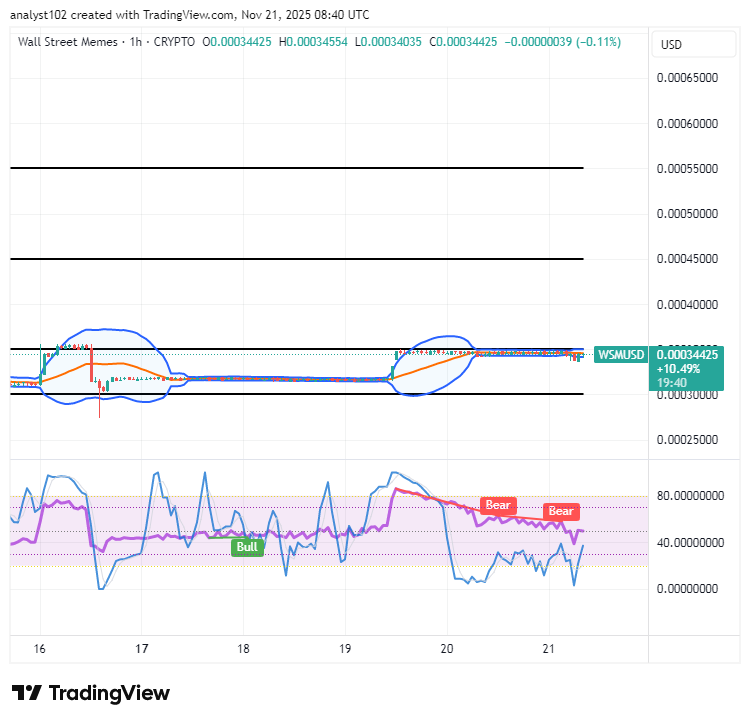
WSM/USD 1-hour chart
The WSM/USD short-term chart reveals the base crypto-economic trade is steady presently, as a rebound is likely.
The Bollinger Bands remain tightly compressed between $0.00035 and $0.0003, signaling a firm consolidation zone that often precedes a decisive shift in market direction. This narrow structure suggests traders are accumulating positions while awaiting a breakout that could define the next major trend. At the same time, the Stochastic Oscillators continue to move in a smooth, wavering pattern, indicating repeated cycles of short-term recovery within the broader structure. In simpler terms, the market keeps pulling back and bouncing again, showing that buyers are gradually regaining strength as momentum rebuilds.
Over the past 24 hours, the $WSM token and its community experienced a coordinated attack, with hackers specifically targeting our Discord server. Our team is actively addressing the situation and working to restore full security.
Over the last 24 hours, The $WSM token and community has undergone a coordinated attack. The hackers specifically targeted our Discord community.
— Wall Street Memes (@wallstmemes) October 12, 2023
We reiterate that no one from the Wall St Memes team will ever direct message you first, or ask for any personal information – even… pic.twitter.com/VwySpXC7cz