Wall Street Memes (WSM) Price Set at $0.00035, Buyers Steady
Estimated Reading Time: 3 minutes
Don’t invest unless you’re prepared to lose all the money you invest. This is a high-risk investment and you are unlikely to be protected if something goes wrong. Take 2 minutes to learn more

Wall Street Memes Price Prediction – November 20
Recent trade flows show WSM holding tight above short-term support as buyers stepped in on minor dips, keeping sell pressure weak. Repeated rebounds from the $0.0003 zone helped lift sentiment, allowing the price to settle firmly around $0.00035 with steady demand.
Recent trade activity shows WSM holding strong against the USD above its short-term support, as buyers continue stepping in on every small dip, helping to limit downward pressure and maintain market stability. A series of quick rebounds from the $0.00028 region improved near-term sentiment, allowing the market to settle around $0.0003, where steady demand continues to shape a stable price outlook.
WSM/USD Market
Key Levels
Resistance levels: $0.0004, $0.00045, $0.0005
Support levels: $0.0003, $0.00025, $0.0002
WSM/USD – 4-hour Chart
On the medium-term chart, the WSM/USD market appears to be settling at $0.00035, as buyers stay steady.
The Bollinger Bands are being consistently tapped along their upper section, indicating that upward market pressure is steadily building. The Stochastic Oscillators are moving in a controlled upward rise, suggesting that long-term holding positions are developing with increasing trader confidence.
Will Sustained Buyer Demand Near The $0.0003 Level Hold WSM Above Its Key Support Zone?
If buyers continue to hold the $0.00035 level with steady strength, WSM trade could soon gather enough momentum to make a clear move upward. Sustained demand at current levels could trigger a gradual breakout, opening room for a clearer upside move in the sessions ahead.
With buyers firmly supporting the $0.0003 level, shorting attempts may continue to lose strength as demand steadily absorbs each dip. This persistent bid tone suggests the market could favor upward movement rather than downside risk, making bearish expectations less convincing while upside prospects grow increasingly feasible.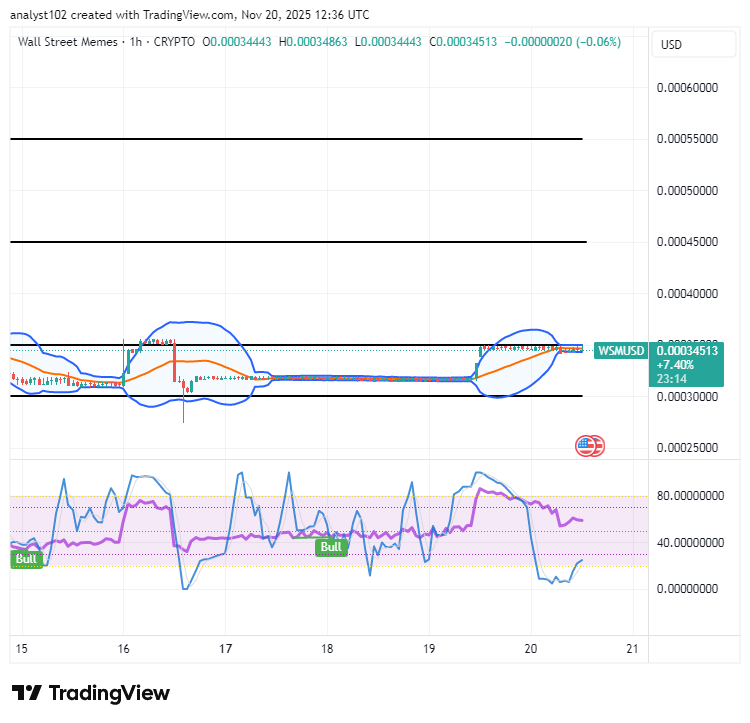
WSM/USD 1-hour chart
The WSM/USD short-term chart showcases the base crypto market settling at $0.00035, as buyers stay steady.
The Stochastic Oscillators have kept a swerving mode that clearly signifies a series of recouping and recovery movements is ongoing across the market. The Bollinger Bands are tightly confined between $0.00035 and $0.0003, reinforcing a stable consolidation structure that may foreshadow a potential trend reversal in the near term.
Explore exciting new trading opportunities with 1–25x leverage! WSM is now available on the Bybit Futures Grid Bot—maximize your strategies and start trading today.
BIGTIME: [https://i.bybit.com/20rabgrK](https://i.bybit.com/20rabgrK)
WSM: [https://i.bybit.com/ab1F9gWH](https://i.bybit.com/ab1F9gWH)
#CryptoTrading #Bybit #LeverageTrading #FuturesBot
🚀 BIGTIMEUSDT & WSMUSDT Contracts now on Bybit!
— Bybit (@Bybit_Official) October 12, 2023
Dive into new trading opportunities with 1-25x leverage. Plus, they’re now on Bybit Futures Grid Bot! Start trading now.
📈 BIGTIME: https://t.co/FAQlbhnzAh
📈 WSM: https://t.co/pb2y2AfMBE#CryptoTrading #Bybit