Wall Street Memes (WSM) Trades Set for a Surge, Sellers Recede
Estimated Reading Time: 3 minutes
Don’t invest unless you’re prepared to lose all the money you invest. This is a high-risk investment and you are unlikely to be protected if something goes wrong. Take 2 minutes to learn more

Wall Street Memes Price Prediction – November 19
Recent sessions showed WSM buyers steadily absorbing each dip against the USD, shrinking bearish momentum as trading volumes rotated upward. Sellers weakened after failing to push prices below support, allowing bullish pressure to consolidate and position the market for a potential upward surge.
The WSM/USD market activity revealed buyers increasingly dominating intraday pullbacks, consistently defending support zones with stronger bid clusters. Bearish attempts to force breakdowns lost strength as liquidity shifted toward accumulating positions. With sellers progressively retreating and volume tilting bullish, momentum compressed into a tighter structure, setting the market primed for an imminent upward surge.
WSM/USD Market
Key Levels
Resistance levels: $0.0004, $0.00045, $0.0005
Support levels: $0.0003, $0.00025, $0.0002
WSM/USD – 4-hour Chart
On the medium-term chart, WSM/USD appears poised for a bullish surge as sellers gradually step aside, easing resistance against upward movement.
The Bollinger Bands are compressing steadily within the $0.00035–$0.0003 zone, marking firm consolidation. Meanwhile, the Stochastic Oscillators hint at a bullish resurgence as buyers rebuild strength, increasing prospects for an imminent upward reversal.
How Does WSM’s Bullish Setup Strengthen as Sellers Recede and Price Action Begins Pointing Toward a Potential Surge?
WSM/USD market’s bullish setup strengthens as diminishing sell pressure allows buyers to reclaim momentum. As volatility tightens and buying volume improves, the price structure pushes upward more steadily, increasing the odds of a continuation surge—so long as key support levels remain strongly protected by buyers.
WSM’s bullish structure strengthens as retreating sell pressure enables buyers to reclaim deeper market control. With volatility tightening and volume gradually rotating upward, price behavior forms a constructive base. This environment increases the likelihood of a sustained upward continuation, provided buyers continue defending key support zones and maintain pressure against weakening bearish liquidity.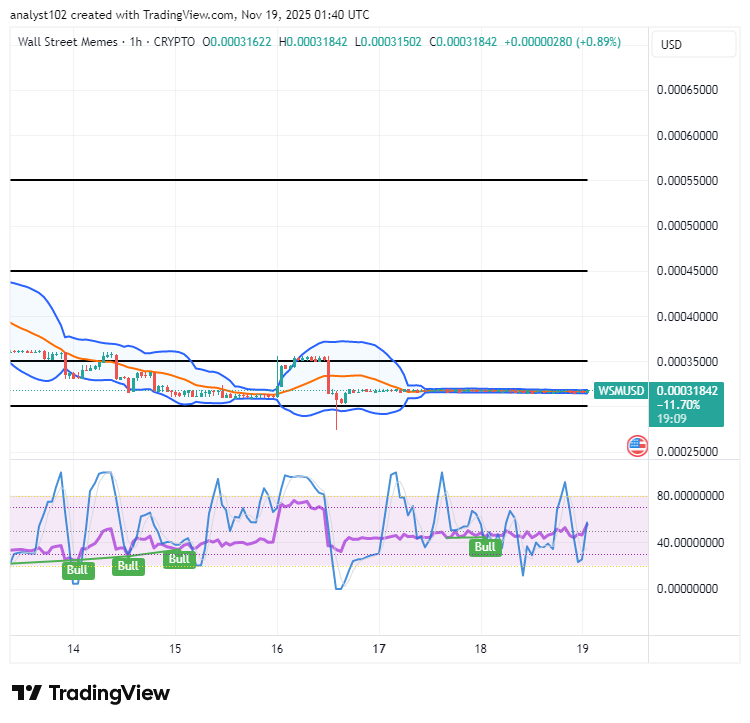
WSM/USD 1-hour chart
The WSM/USD short-term chart shows the base crypto-economic set for a surge, as sellers recede actions.
Currently, the Bollinger Bands are tightly confined between $0.00035 and $0.0003, reinforcing a stable consolidation structure that may foreshadow a trend reversal. At the same time, the Stochastic Oscillators maintain subtle upward signals, suggesting momentum is slowly gathering in favor of a potential rally.
$WSM / $USDT is now officially tradeable on #Bybit Perpetuals for all interested traders.
Trade here: [https://i.bybit.com/1Wab4K3z](https://i.bybit.com/1Wab4K3z)
Also want your project listed on Bybit? Share your suggestions right here:
$WSM community, we saw your Tweets! 👏$WSM / $USDT is now tradeable on #Bybit Perpetuals.
— Bybit (@Bybit_Official) October 13, 2023
Trade here: https://t.co/le4XyVyXaZ
Also want your project listed? Share your suggestions here:https://t.co/W7EWJVVNV5 https://t.co/XgXoL7g0rF