Wall Street Memes (WSM) Price Consolidates, Building for Surges
Estimated Reading Time: 4 minutes
Don’t invest unless you’re prepared to lose all the money you invest. This is a high-risk investment and you are unlikely to be protected if something goes wrong. Take 2 minutes to learn more

Wall Street Memes Price Prediction – November 18
Sustained demand emerged after WSM/USD held firm above a key intraday support, attracting momentum traders who anticipated a breakout. Gradual accumulation by bulls compressed volatility, forming a consolidation base that hinted at renewed surges as buying pressure quietly strengthened.
Market participants remain cautiously optimistic that WSM/USD will stay afloat above the crucial $0.0003 threshold, as consistent dip-buying supports price stability. The tightening consolidation structure suggests bulls are quietly reinforcing their positions, aiming to prevent any breakdown. If this defensive strength persists, the pair could gather enough momentum to attempt renewed upward surges in the near term.
WSM/USD Market
Key Levels
Resistance levels: $0.0004, $0.00045, $0.0005
Support levels: $0.0003, $0.00025, $0.0002
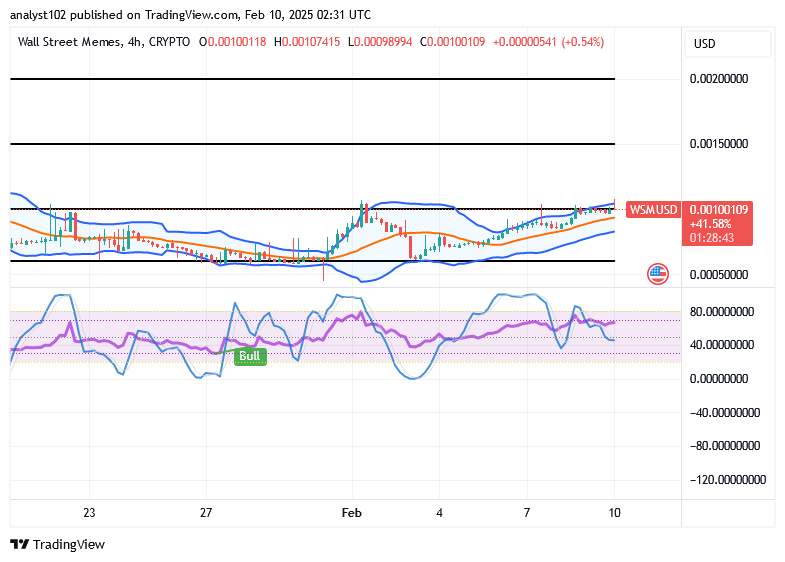
WSM/USD – 4-hour Chart
The WSM/USD medium-term chart showcases that the crypto economy is consolidating and momentum for an upward surge.
The Bollinger Bands are gradually compressing within a defined channel between $0.00035 and $0.0003, reflecting sustained range-bound equilibrium. Meanwhile, the Stochastic Oscillators are attempting to reassert bullish momentum, signaling that buyers are rebuilding recovery strength and improving the probability of a near-term upward reversal.
Can WSM/USD Maintain Its Consolidation Structure While Sustaining Price Stability Above The Key $0.0003 Level?
Current chart behaviors suggest WSM/USD can likely preserve its consolidation phase above $0.0003, as repeated rebounds at that level reveal strong buyer sensitivity. If support continues to hold, strengthening momentum could catalyze a breakout attempt once volatility begins expanding upward.
WSM/USD continues to show encouraging resilience as buyers repeatedly defend the $0.0003 support zone, reinforcing a tightening consolidation pattern. This sustained accumulation signals strengthening sentiment, suggesting the market may be preparing for a calculated upward extension once volatility widens. If bullish pressure endures, a breakout attempt appears increasingly probable.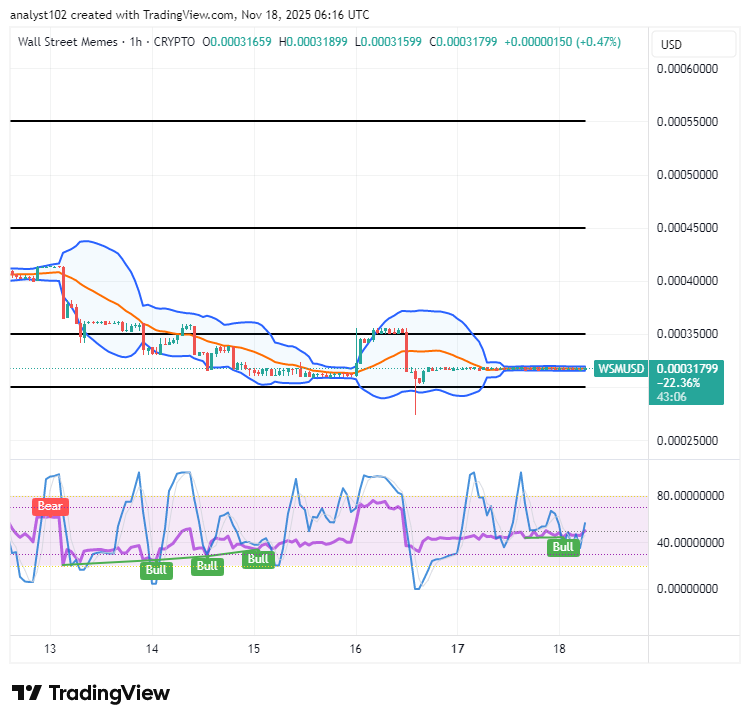
WSM/USD 1-hour chart
The WSM/USD short-term chart demonstrates that the base crypto-economic market is consolidating and gaining momentum for an upward surge.
The Bollinger Bands are sliding downward and re-centering within the $0.00035–$0.0003 corridor, reinforcing a consolidative structure that often precedes a potential trend reversal. Concurrently, the Stochastic Oscillators are sustaining subtle bullish inflections, signaling progressively building momentum that supports the likelihood of an impending upside breakout.
Dive into new trading opportunities with 1–25x leverage. Plus, they’re now on Bybit Futures Grid Bot for smarter automated strategies! Start trading now.
BIGTIME: [https://i.bybit.com/20rabgrK](https://i.bybit.com/20rabgrK)
WSM: [https://i.bybit.com/ab1F9gWH](https://i.bybit.com/ab1F9gWH)
#CryptoTrading #Bybit
🚀 BIGTIMEUSDT & WSMUSDT Contracts now on Bybit!
— Bybit (@Bybit_Official) October 12, 2023
Dive into new trading opportunities with 1-25x leverage. Plus, they’re now on Bybit Futures Grid Bot! Start trading now.
📈 BIGTIME: https://t.co/FAQlbhnzAh
📈 WSM: https://t.co/pb2y2AfMBE#CryptoTrading #Bybit