Wall Street Memes (WSM) Trade Validates Basis; Rise Is Expected
Estimated Reading Time: 4 minutes
Don’t invest unless you’re prepared to lose all the money you invest. This is a high-risk investment and you are unlikely to be protected if something goes wrong. Take 2 minutes to learn more

Wall Street Memes Price Prediction – November 17
Wall Street Memes (WSM) trading activity has reinforced its underlying market structure, confirming a solid technical basis. Strengthening bid flows and resilient support zones suggest upward traction is building, positioning the asset for a likely continuation of its anticipated rise.
The Wall Street Memes trading behavior continues to validate its underlying technical basis, signaling improved market confidence. Strengthening bid momentum, narrowing pullback ranges, and firm support zones collectively point to a developing bullish structure. These conditions suggest the asset is preparing for a sustained upward move, with a measured rise increasingly expected.
WSM/USD Market
Key Levels
Resistance levels: $0.0004, $0.00045, $0.0005
Support levels: $0.0003, $0.00025, $0.0002
WSM/USD – 4-hour Chart
Today’s analysis of the WSM/USD medium-term chart demonstrates that the crypto trade is validating its basis, with a rising force expected.
The Stochastic Oscillators have been trying to put back signs that indicate that buyers are settling for ideal recouping velocities, strengthening confidence in an imminent rebound. The Bollinger Bands show a mild downward trajectory, dipping briefly before leveling off, suggesting a potential reversal, as underlying volatility begins tightening gradually.
Does WSM’s Validated Trading Basis Provide Enough Structural Strength to Support a Sustained Bullish Rise?
The WSM/USD trading basis shows a strengthening market structure, characterized by tighter pullbacks, steady bid absorption, and rising momentum, all supporting a sustained upward bias. As long as price maintains its higher-low formation and key support levels hold, the setup favors a sustained bullish continuation in the near term.
WSM’s validated trading basis reflects improving structural strength, supported by sustained bid absorption, contracting downside volatility, and a steady higher-low sequence. As long as the broader crypto market continues to defend its intraday support zones and momentum indicators retain upward alignment, conditions remain favorable for an extended bullish move, with increasing probability of a measured upside breakout in the near term.
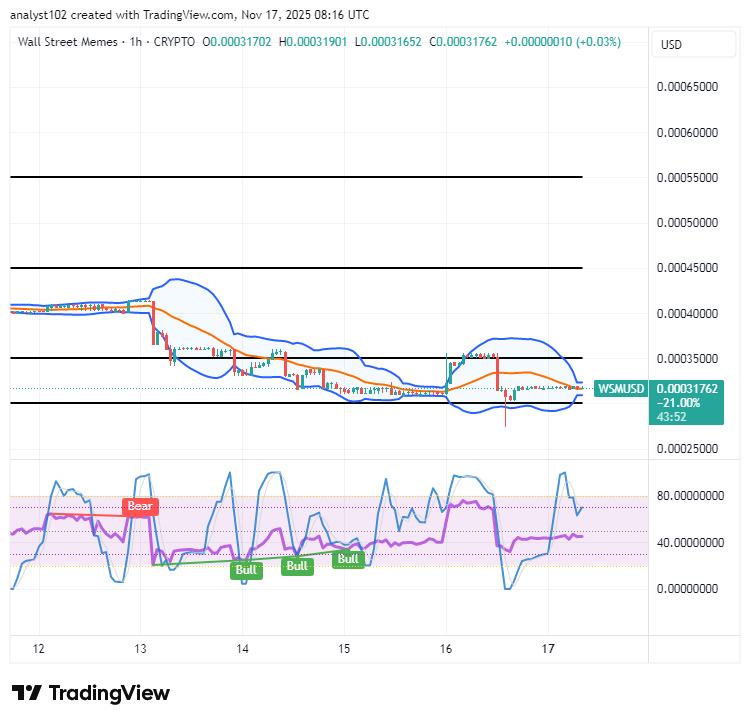
WSM/USD 1-hour chart
The WSM/USD short-term chart reflects this, showing that the base crypto-economic trade is validating its technical basis, with a rising move increasingly expected in the near term.
The Stochastic Oscillators have been resorting to keeping variant promissory upswings on the threshold of bullish signs, indicating growing momentum for a potential upward breakout. The Bollinger Bands are trending downward, getting a reset between the trade lines of $0.00035 and $0.0003, suggesting consolidation before a possible trend reversal emerges.
$WSM / $USDT is now tradeable on #Bybit Perpetuals, offering enhanced leverage and trading opportunities.
Trade here: [https://i.bybit.com/1Wab4K3z](https://i.bybit.com/1Wab4K3z)
$WSM community, we saw your Tweets! 👏$WSM / $USDT is now tradeable on #Bybit Perpetuals.
— Bybit (@Bybit_Official) October 13, 2023
Trade here: https://t.co/le4XyVyXaZ
Also want your project listed? Share your suggestions here:https://t.co/W7EWJVVNV5 https://t.co/XgXoL7g0rF