XRP (XRP/USDT) Gearing Up for More Upside Actions
Estimated Reading Time: 3 minutes
Don’t invest unless you’re prepared to lose all the money you invest. This is a high-risk investment and you are unlikely to be protected if something goes wrong. Take 2 minutes to learn more
XRP Long-term Analysis: Ranging
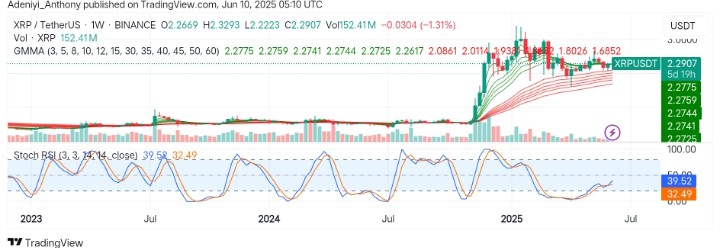
After a strong parabolic rise in late 2024 and wave-like moves in early 2025, the market for XRP against the Tether has entered a consolidation phase with decreasing volatility. The Guppy Multiple Moving Averages (GMMAs) show compression, indicating a neutral-to-bullish sentiment with potential for expansion.
However, the current condition of the Stochastic RSI suggests hope, as the lines see strength to climb from the oversold territory, indicating a renewed bullish momentum could develop soon if price action confirms it.
Currently, XRP trades at $2.2910, printing 152.41 million traded volumes for the week.
Technical Indicators
Major Resistance Levels: $2.3500, $2.7384, and $2.9364
Major Support Levels: $2.0861, $1.8026, and $1.4700
XRP Technical Analysis
The market for XRP against the Tether on the weekly timeframe shows a volatility squeeze within the compressed sets of EMAs, suggesting the possibility of an impending breakout. However, the Stochastic RSI appears to climb from an oversold region, indicating an early sign of bullish momentum.
On the other hand, the price is currently operating within a tight channel after a large bullish move. However, the trading volume appears to be dropping despite the GMMAs maintaining a bullish weekly structure.
To this end, a close above $2.3500 with a strong volume will confirm a breakout towards $3.2050; otherwise, a close below $2.0000 would invalidate the move.
XRP/USDT Analysis: A Potential Breakout or Breakdown: What’s Next?
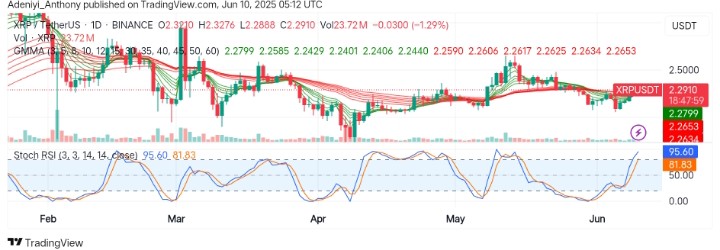
On the daily chart, XRP/USDT is consolidating after a rally to the north, with the price holding above key mid-range support at $2.0861, maintaining a bullish structure. However, the GMMAs compression signals decreasing volatility and potential for directional expansion.
On the other hand, the Stochastic RSI signals a rising but overbought condition, indicating a strong bullish momentum mixed with caution.
To this end, continued momentum above $2.3500 would confirm a breakout above $2.7500 in the short term. However, caution is needed as a pullback looms due to the overbought condition of the momentum oscillator.
You can purchase crypto coins here. Buy LBlock