XRP (XRP/USDT) Faces Rejection in Its Bullish Track
Estimated Reading Time: 3 minutes
Don’t invest unless you’re prepared to lose all the money you invest. This is a high-risk investment and you are unlikely to be protected if something goes wrong. Take 2 minutes to learn more
XRP long-term Analysis: Ranging
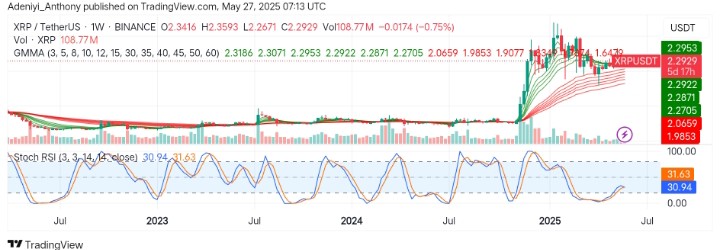
The market for XRP against the Tether has experienced a healthy pullback after an explosive bullish rally at the beginning of the year, finding support above the $2.0000 level. However, as it stands, the pair has seen a loss of 0.75%, suggesting a bearish momentum is building, but the bulls are still in control as seen in the formation of the Guppy Multiple Moving Averages (GMMAs).
Recently, the pair has retraced from a high of around $2.9000, cooling off at the current level with the option of breaking towards either side. The Stochastic RSI seems to display a bearish crossover while moving to the north.
Currently, XRP trades at $2.2929, printing over 100 million traded volumes for the week.
Technical Indicators
Major Resistance Levels: $2.3400, $2.6700, and $2.8400
Major Support Levels: $2.1700, $1.9800, and $1.6400
XRP Technical Analysis
The price action of the XRP against the Tether on the weekly chart shows the pair is consolidating after a bullish impulse towards $3.0000. However, the short-period EMAs are still above the long-period EMAs, suggesting bullish traders are still in control of the market despite the minor loss recorded in this timeframe.
On the other hand, the Stochastic RSI indicates the willingness of the bullish traders to control the market fully. Still, the lines indicate a bearish interchange as the blue delves below the orange, indicating a building bearish momentum as the volume holds steady.
To this end, a close above $2.3400 with a change in the direction of the oscillator would indicate a bullish continuation; otherwise, if the oscillator’s lines continue to move in the current direction, the bears might take control.
XRP/USDT Analysis: Where from Here?
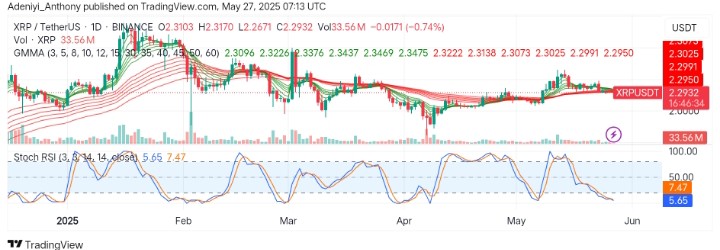
During the daily timeframe, XRP/USDT shows more compression, reflecting that the market is waiting as the oscillator delves further into the oversold region. However, the structure of the GMMAs suggests the bullish setup is still intact as the cluster of EMAs appears to be well-positioned.
To this end, if the buyers can defend the current level, a move to the north would be recorded. Conversely, a break below $2.2700 would invalidate this move as the price would drop further south.
You can purchase crypto coins here. Buy LBlock