XRP (XRP/USDT) Hints at a Potential Bullish Continuation
Estimated Reading Time: 2 minutes
Don’t invest unless you’re prepared to lose all the money you invest. This is a high-risk investment and you are unlikely to be protected if something goes wrong. Take 2 minutes to learn more
XRP Long-term Analysis: Bullish
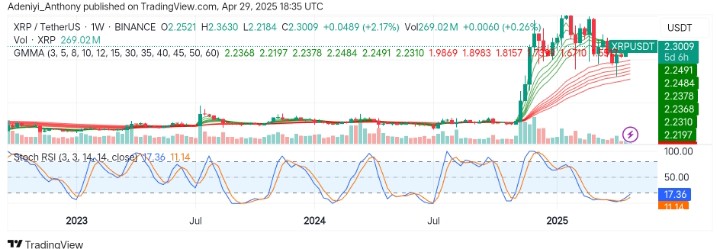
Followed by a high-level consolidation phase. XRP against the Tether has shown a strong breakout sign. However, the price is currently trading above the Guppy Multiple Moving Averages (GMMAs), indicating strong long-term trend support, even amid previous short-term corrections.
Recently, the price has respected the support levels formed by the short-period EMAs during retracement and appears to be creating a base around $2.000. However, the Stochastic RSI already displays a bullish crossover from an oversold zone, suggesting an impending northbound movement in the near term.
Currently, XRP trades at $2.3009, recording over 269 million traded volumes for the week.
Technical Indicators
Major Resistance Levels: $2.600, $2.900, and $3.300
Major Support Levels: $2.230, $2.000, and $1.730
XRP Technical Analysis
The analysis of XRP against the Tether on a weekly timeframe shows the pair is preparing for another round of upward momentum after what seems to be a prolonged consolidation phase. However, the price action above the sets of EMAs suggests the XRP has maintained a long-term bullish outlook despite previous corrections.
The Stochastic RSI, on the other hand, displays a bullish crossover, signaling a northbound movement is imminent as the pair sees a 2.17% weekly gain. To this end, XRP/USDT could be set for another breakout leg towards fresh highs.
XRP/USDT Analysis: What to Expect
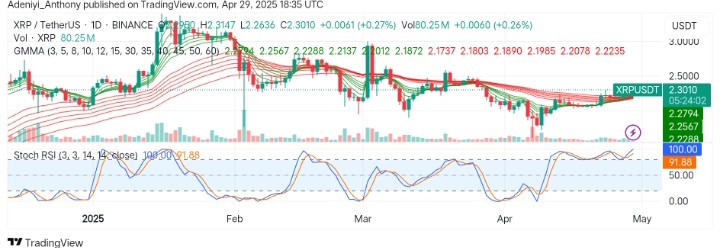
On the daily chart, XRP/USDT Shows a slight bullish momentum with a 0.27% gain. However, the GMMAs hint at a potential trend shift as the pair’s price hit above the indicator.
From another perspective, the Stochastic RSI suggests the pair’s upside movement nears exhaustion as the blue line reads 100. This indicates the pair might experience a short-term pullback before a bullish continuation. To this end, if momentum holds, the coin could test recent highs around $2.500.
You can purchase crypto coins here. Buy LBlock