XRP (XRP/USDT) Approaches a Critical Level Amid Market Weakness
Estimated Reading Time: 3 minutes
Don’t invest unless you’re prepared to lose all the money you invest. This is a high-risk investment and you are unlikely to be protected if something goes wrong. Take 2 minutes to learn more
XRP Long-term Analysis: Bearish
The market for XRP against the Tether was formerly on an impressive rally in around the fourth quarter of last year, surging upside with improving bullish participation. However, the pair seems to be consolidating after hitting a strong resistance level around the $2.2200 zone.
Recently, the pair’s price has formed lower highs, suggesting weakening bullish momentum as the Guppy Multiple Moving Averages (GMMAs) and the Stochastic oscillator signal price might slip further to the south in the near term.
Currently, XRP trades at $1.9042, with over 800 million volumes traded for the week already.
Technical Indicators
Major Resistance Levels: $1.9200, $2.1000, and $2.2200
Major Support Levels: $1.8272, $1.7407, and $1.5900
XRP Technical Analysis
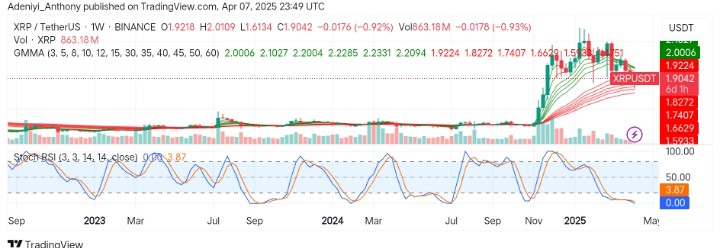
On the weekly timeframe, XRP against the Tether appears to show a clear movement towards the north at the beginning of the year. However, current price actions suggest a descending triangle, which moves in favor of a downside breakout except with the intervention of the bulls.
The GMMAs appear to be converging since reaching their former height as the short-period EMAs move closer to the long-period EMAs as the volume traded dwindles. On the other hand, the momentum oscillator beneath the chart suggests the pair is oversold. However, with the direction of the lines of the indicator, the price might see a breakout to the south for a while.
To this end, a break below the $1.8272 support level would indicate further movement towards $1.5900. Conversely, moving above the immediate resistance level in the coming session would suggest an impending move to the north.
XRP/USDT Analysis: A Breakout or Breakdown?
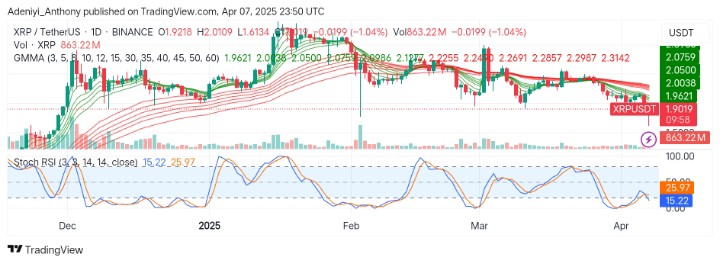
On the daily chart, XRP/USDT is showing consistent rejection from the short-period EMAs, confirming current bearish pressure as the price moves further south. Also, the reduced volume and the signal from the Stochastic RSI suggest reduced interest in the pair as the lines point to the south.
However, the appearance of the Stochastic lines deep into the oversold region indicates that the price might move in the short term to the south, but a potential bounce might play out if buyers set in.
To this end, a turn in the direction of the blue line would confirm the re-entrance of the bulls; otherwise, a break below the current level would suggest more decline before any change in direction.
You can purchase crypto coins here. Buy LBlock