Ethereum (ETH) Retraces to $4,432 Low, Upward Move Likely
Estimated Reading Time: 2 minutes
Don’t invest unless you’re prepared to lose all the money you invest. This is a high-risk investment and you are unlikely to be protected if something goes wrong. Take 2 minutes to learn more

Ethereum Price Long-Term Analysis: Bullish
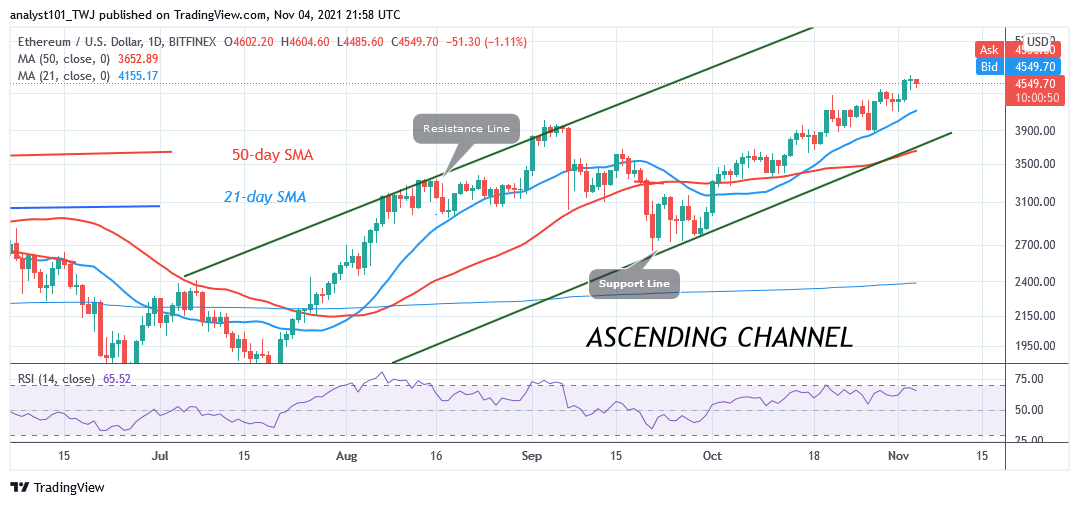
On November 3, Ethereum’s (ETH) price has rallied to a $4,642 high. The upward move has been stalled because of the resistance at $4,640. Ether’s price is fluctuating below the recent high. Today, buyers are resuming upward retesting the recent high. If buyers push ETH price above $4,640, the market will rally above $4,800. However, if the bulls fail to break the recent high, Ether will fall and resume a sideways move. Ether’s price will fluctuate between $4,450 and $4,640.
Ethereum Indicator Analysis
Ether’s price bars are still above the moving averages as price finds support above the 21-day SMA. If the ETH price breaks below the moving averages, the bullish scenario will be invalidated.
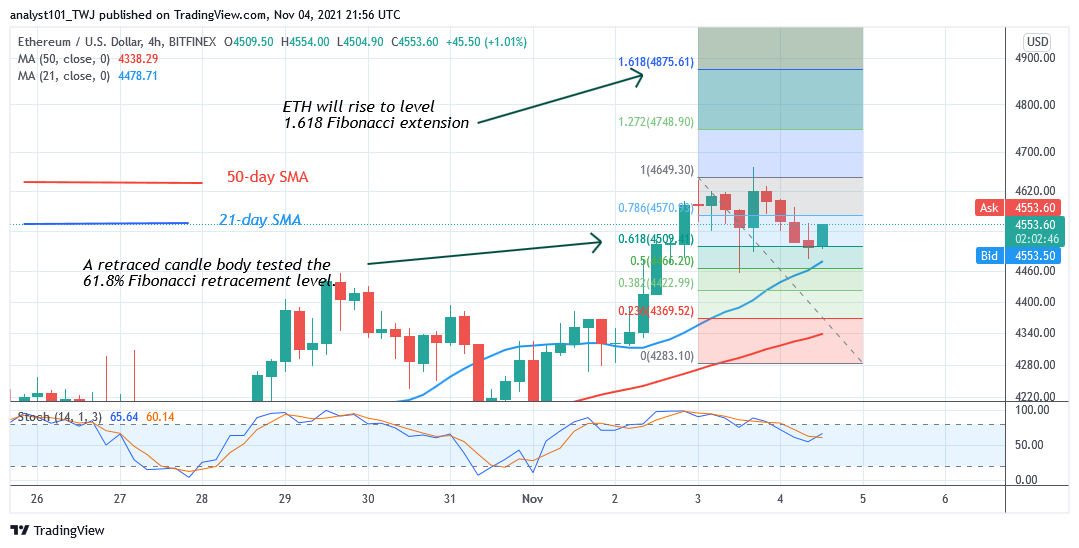
Ether has risen to level 66 of the Relative Strength Index period 14. Ether is above 80% area of the daily stochastic. The stochastic bands are sloping upward indicating the uptrend. The coin is in a bullish momentum.
Technical indicators:
Major Resistance Levels – $2, 600, $2,800, $3,000
Major Support Levels – $1.500, $1, 300, $1,100
What Is the Next Direction for Ethereum?
Ether is in an upward move. It is resuming a new uptrend to retest or break the recent high. Meanwhile, on November 3 uptrend; a retraced candle body tested the 61.8% Fibonacci retracement level. The retracement indicates that Ethereum will rise to level 1.618 Fibonacci extension or $4,875.61.
You can purchase crypto coins here. Buy Tokens
Note: Cryptosignals.org is not a financial advisor. Do your research before investing your funds in any financial asset or presented product or event. We are not responsible for your investing result