Bitcoin (BTC/USD) Price Lowers Slightly in $50,000 and $45,000
Estimated Reading Time: 3 minutes
Don’t invest unless you’re prepared to lose all the money you invest. This is a high-risk investment and you are unlikely to be protected if something goes wrong. Take 2 minutes to learn more
Bitcoin Price Prediction – September 1
The most expensive cryptocurrency’s price lowers slightly against the US Dollar in the ranges of $50,000 and $45,000 as the new month begins today. The market witnesses a percentage rate of about 0.77 as the price trades around the line of $47,827 as of writing.
BTC/USD Market
Key Levels:
Resistance levels: $50,000, $52,500, $55,000
Support levels: $45,000, $42,500, $40,000,
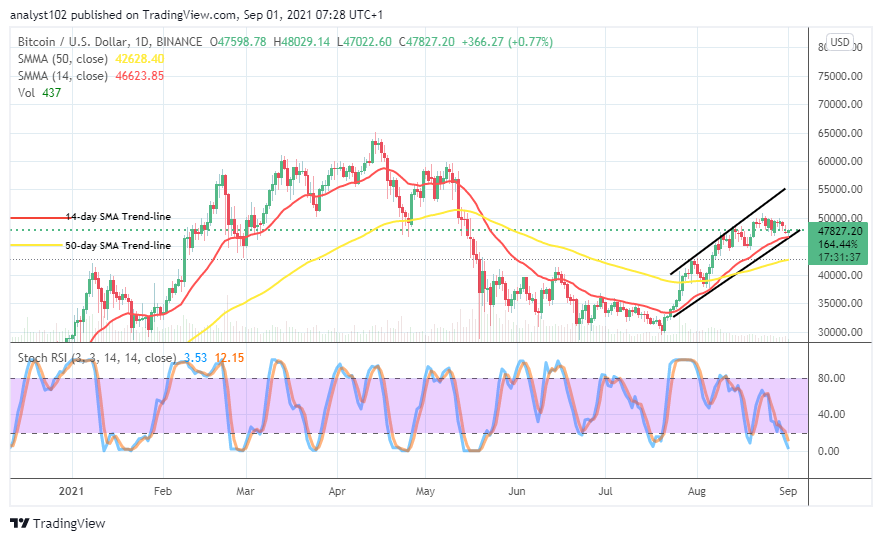
BTC/USD – Daily Chart
The bullish channel trend lines remain validly intact on the BTC/USD daily chart as the crypto’s price lowers slightly against the lower bullish channel. The 14-day SMA indicator is above the 50-day SMA indicator. And, the bullish trend-line is in a supportive posture to the smaller SMA. The Stochastic Oscillators are in the oversold region, slightly pointing to the south close to the range of 0. That suggests that there may still be a relative slippage in the crypto’s valuation, but it tends to short-live.
What could be the next price direction for the BTC/USD market as the price lowers slightly in ranges of $50,000 and $45,000?
The current sense of the trading situation of the BTC/USD market as the price lowers slightly in ranges of $50,000 and $45,000 could be to allow bulls to locate support near or around the smaller figure value. Any notable bullish candlestick that tends to emerge against the trend-line of the 14-day SMA from a lower trading spot will most likely portend a come-back of an upward motion. That could achieve, using a 1-hour trading chart for early observation.
On the downside, it indicated that the BTC/USD market bears do not possess much power to reliably push down the crypto economy beyond the level at $45,000. There seems that price may have to take its time to prepare the grand closely around the smaller SMA trend-line, featuring smaller-downs. A long holding of price around point beneath the $50,000 will allow bears a continual regaining of the market’s control. But, a sudden breakout of that level may nullify that assumption in the end.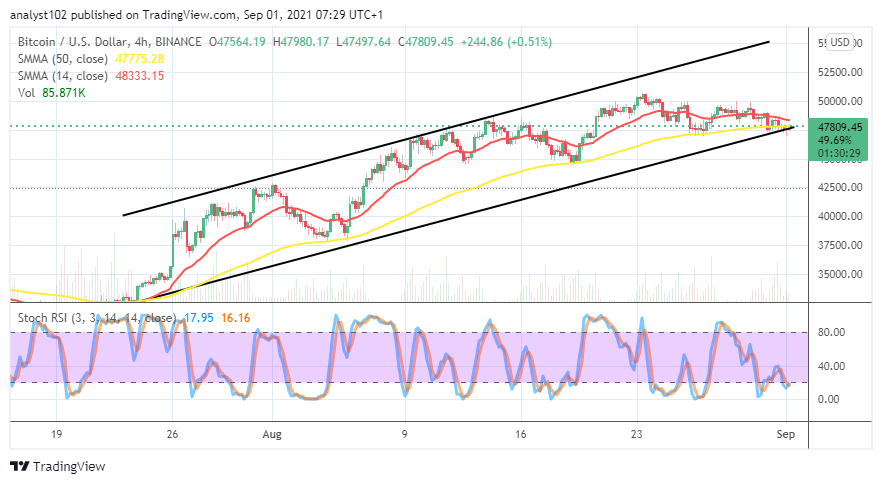
BTC/USD 4-hour Chart
The BTC/USD medium-term chart reveals that the crypto’s price lowers slightly around the trend lines of the lower bullish channel and the bigger SMA. The 14-day SMA indicator is closely above the 50-day SMA indicator. The Stochastic Oscillators are seemingly attempting to cross the lines northbound at range 20. That signifies that the crypto’s worth is preparing to push the stance against the US fiat currency.
Note: Cryptosignals.org is not a financial advisor. Do your research before investing your funds in any financial asset or presented product or event. We are not responsible for your investing results.
You can purchase crypto coins here. Buy Tokens