Tamadoge (TAMA/USD): Bulls Assert Control, Initiating a Bullish Trend
Estimated Reading Time: 3 minutes
Don’t invest unless you’re prepared to lose all the money you invest. This is a high-risk investment and you are unlikely to be protected if something goes wrong. Take 2 minutes to learn more

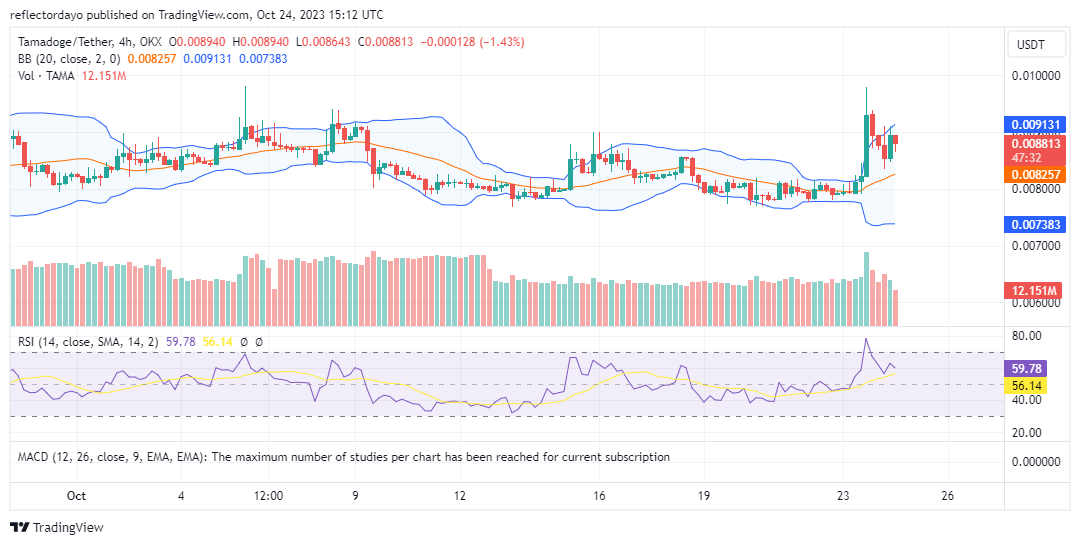
After a prolonged period of equilibrium between supply and demand at the $0.008 price level, the TAMA/USD bulls have emerged victorious, breaking the market out of its stalemate. Initially, the bulls pushed towards the $0.010 price level before a price retracement occurred. This retracement established a higher support level, which is expected to bolster the continuity of the bullish trend. Considering the initial bullish surge during the 5th hour of October 23rd, the $0.010 price level has been identified as the bulls’ target.
Key Levels
- Resistance: $0.013, $0.014, and $0.015.
- Support: $0.00800, $0.0075, and $0.0073.
TAMA/USD Price Analysis: The Indicators’ Point of View
Following the TAMA/USD bullish movement observed on October 23rd, an increase in market volatility has become evident. The Bollinger Bands indicator is now indicating the formation of an ascending price channel, with the lower standard deviation curve converging towards the upper standard deviation and the moving average curve.
This transformation has been made possible by the establishment of a higher support level around the $0.0085 price range. However, it’s worth noting that the $0.00900 resistance level is approaching. Should the $0.0085 support hold and the $0.0090 price level be maintained, it could lead to a market consolidation in this range, ultimately reinforcing the foundation for the continuation of the bullish trend.

Tamadoge Short-Term Outlook: 1-Hour Chart
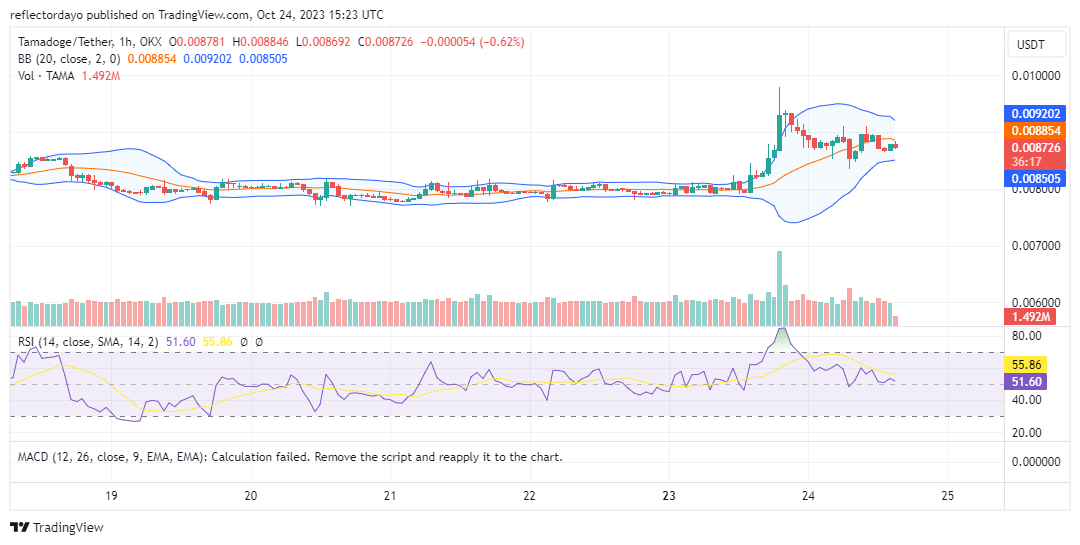
Analyzing the Tamadoge market from a 1-hour chart perspective, a robust resistance level at $0.0090 is evident. Despite this resistance, the bullish trend persists, with the emergence of a slightly higher support level at $0.0087. These market dynamics have resulted in the convergence of the Bollinger Bands, reflecting a temporary reduction in volatility. This convergence suggests the potential for a forthcoming price breakout, and there is optimism that it may surpass the $0.0090 price threshold.
Like a pro, level up your Tamadoge!
Level up your Tamadoge like a pro! 🎮🚀
Our new XP system lets you upgrade your stats so you can earn more $TAMA!
Get in on the action and win one of five exclusive playable NFTs in our @gleamapp giveaway 👉 https://t.co/OqeyLwWFIe pic.twitter.com/YFZZioo9xI
— TAMADOGE (@Tamadogecoin) October 23, 2023
Do you want a coin that will be 100 times more valuable in the next few months? That is Tamadoge. Buy TAMA today!