Wall Street Memes (WSM/USD) Trades Tick Up, Showing Strength
Estimated Reading Time: 4 minutes
Don’t invest unless you’re prepared to lose all the money you invest. This is a high-risk investment and you are unlikely to be protected if something goes wrong. Take 2 minutes to learn more

Wall Street Memes Price Prediction – May 20
Some erratic negative moves in the pricing systems of the Wall Street Memes coin’s valuation paired with the trade’s worth of the American currency are now gradually surging from the lower trend line of the Bollinger Bands, given that the crypto-economic trades now tick up, signifying strength in its inputting pushing phases.
Given that the price action is showing renewed momentum in the WSM/USD market, emerging activity around the lower and middle Bollinger Bands indicates that buyers are increasingly asserting control from key support zones. This growing bullish effort follows the asset’s all-time low valuation and signals a strengthening market structure. The gradual recovery supports a constructive long-term outlook, making it strategically reasonable for long-term investors to maintain their staking positions—particularly as market confidence builds amid ongoing pressure on the US dollar.
WSM/USD Market
Key Levels
Resistance levels: $0.0015, $0.002, $0.0025
Support levels: $0.0005, $0.0004, $0.0003
WSM/USD – 4-hour Chart
The WSM/USD 4-hour chart pictures it that the crypto-economic trades now tick up, signifying strength in its inputting pushing phases.
The stochastic oscillators are currently positioned under a mere bearish signal, suggesting that bulls are in the process of gradually regaining solid, promising, upward, and resilient momentum. It is evident that various candlestick patterns have formed around the middle and lower Bollinger Bands, indicating that a firm, supportive, optimistic, and technical foundation is being established near the lower end of the indicator range.
Could the WSM/USD market be experiencing a temporary phase of consolidation as it works to establish firm support closely above $0.0005 mark?
It is not going to be easy for the WSM/USD market bears to hold positions freely and steadily beyond the support of $0.0005, as the crypto-economic trades now tick up, signifying strength in its inputting capacity rate.
Given the current price action below the $0.001 level, the WSM/USD market appears to be building a solid base that supports the potential for stable rebounds once a breakout occurs. Long-term investors are well-positioned to accumulate at favorable levels, with technical signals pointing to structurally supported upward moves in future cycles. While short-term volatility may continue, the overall trend suggests a positive long-term outlook and strategic value growth.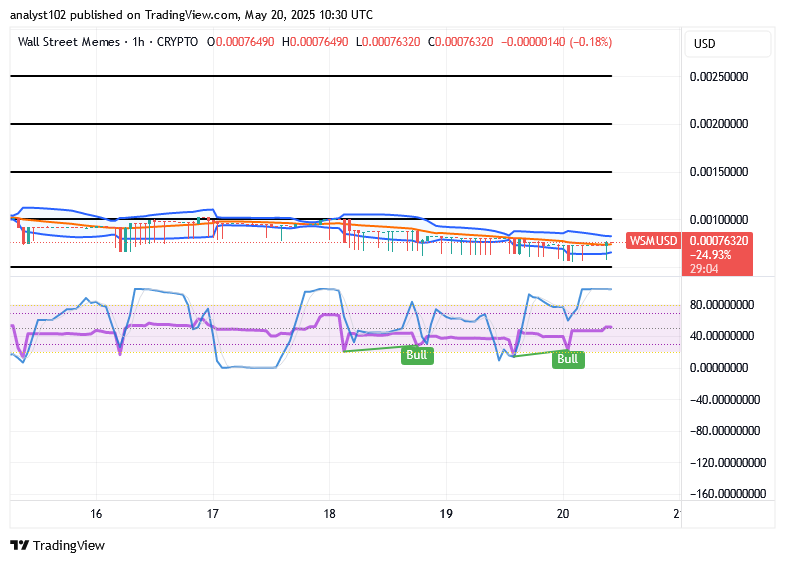
WSM/USD 1-hour chart
The 1-hour chart reflects that the crypto-economic trades now tick up, signifying strength in its inputting pushing phases.
The stochastic oscillators continue to fluctuate within a bullish outlook, downplaying the likelihood of sustained selling pressure. Meanwhile, the Bollinger Bands are slightly tilted east-southward around the $0.0005 level, signaling that buyers are gradually gaining traction and positioning for potential steady rebound movements.
BIGTIMEUSDT & WSMUSDT Perpetual Contracts are now officially live on Bybit platform!
🚀 BIGTIMEUSDT & WSMUSDT Contracts now on Bybit!
— Bybit (@Bybit_Official) October 12, 2023
Dive into new trading opportunities with 1-25x leverage. Plus, they’re now on Bybit Futures Grid Bot! Start trading now.
📈 BIGTIME: https://t.co/FAQlbhnzAh
📈 WSM: https://t.co/pb2y2AfMBE#CryptoTrading #Bybit