Wall Street Memes (WSM/USD) Market Remakes, Eyeing Breakout
Estimated Reading Time: 3 minutes
Don’t invest unless you’re prepared to lose all the money you invest. This is a high-risk investment and you are unlikely to be protected if something goes wrong. Take 2 minutes to learn more
Wall Street Memes Price Prediction – May 19
At this time of this trade sessions of WSM/USD, some pricing motions are made toward finding basis around the lower Bollinger Band’s trend line, as the bargaining outlook of the pairing instruments shows that the crypto-economic market remakes points, eyeing a breakout below the line of $0.001.
With trade lines once again indicating momentum in the WSM/USD market, the business operations surrounding the pair appear to be steadily gaining strength following its all-time low valuation. This resurgence suggests a constructive long-term outlook; making it strategically sound for long-term capitalists to maintain their staking positions in the base instrument, especially as confidence gradually builds against the backdrop of the US currency’s relative pressure.
WSM/USD Market
Key Levels
Resistance levels: $0.0015, $0.002, $0.0025
Support levels: $0.0005, $0.0004, $0.0003
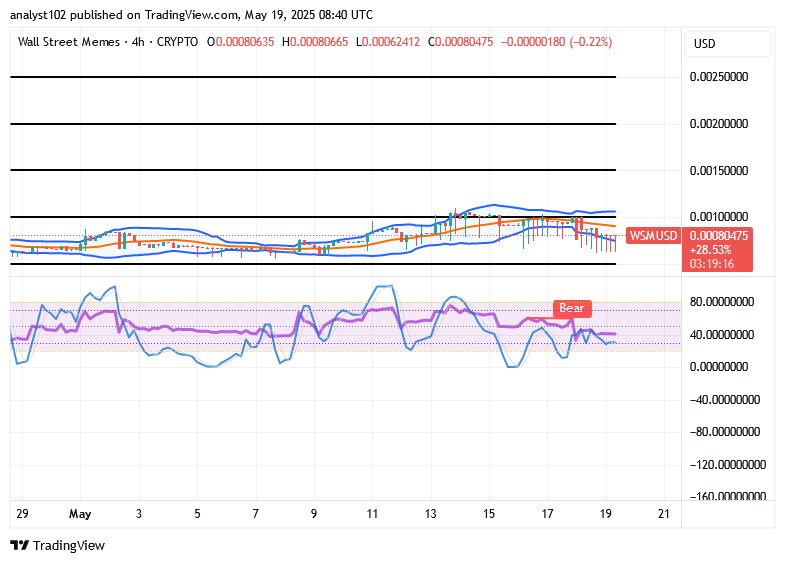
WSM/USD – 4-hour Chart
The WSM/USD 4-hour chart shows that the crypto-economic market is remaking points, eyeing a breakout below the line of $0.001.
It is evident that various candlestick patterns have formed around the middle and lower Bollinger Bands, indicating that a foundation is being established near the lower end of the indicator range. The stochastic oscillators are currently positioned under a tentative bearish signal, suggesting that bulls are in the process of gradually regaining momentum.
Could the WSM/USD market be entering a troubling phase of indecision as it struggles to stabilize toward $0.0005 mark?
Seeing the WSM/USD market entering a negative phase to get stabilized above $0.0005 would be to let long-term position holders of the base instrument to maximize huge profits, given that the price remakes basis, eyeing a breakout below the line of $0.001.
Overall, given the current dynamics in the comparative behavior of both trading instruments, there is strong justification for the view that long-term capitalists are well-positioned to accumulate increased base valuation relative to its counterpart. This outlook is supported by signs of structurally driven potential rebounds expected in upcoming market cycles. While short-term fluctuations may persist, the broader trajectory favors strategic accumulation and long-term value growth.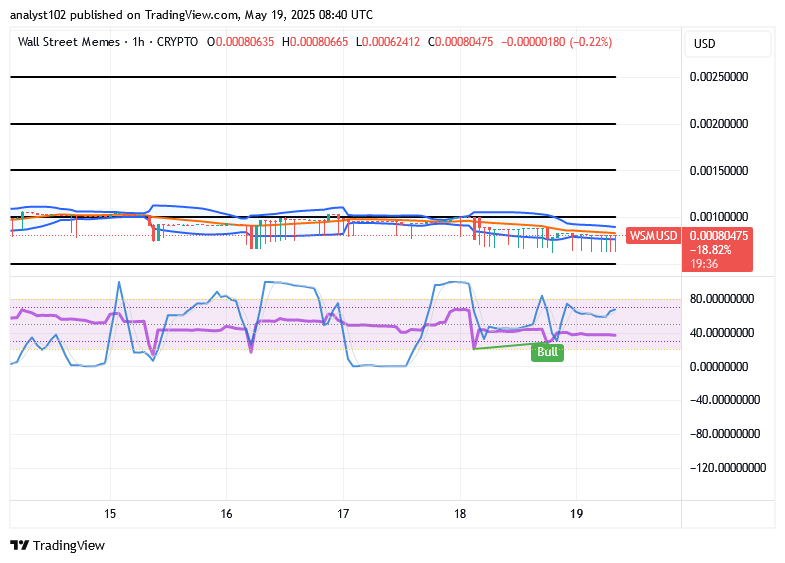
WSM/USD 1-hour chart
The 1-hour chart reflects that the crypto-economic trade is forming new bottoms, eyeing a potential breakout.
The Bollinger Bands indicators are noticeably stretched, resisting sustained negative moves and suggesting an impending volatility contraction. The stochastic oscillators are now formed on the threshold of a bullish signal note, indicating that most moves to the minus side will likely serve as strategic production zones for calculated longing entry points.
$WSM / $USDT is now officially tradeable on #Bybit Perpetuals market!
$WSM community, we saw your Tweets! 👏$WSM / $USDT is now tradeable on #Bybit Perpetuals.
— Bybit (@Bybit_Official) October 13, 2023
Trade here: https://t.co/le4XyVyXaZ
Also want your project listed? Share your suggestions here:https://t.co/W7EWJVVNV5 https://t.co/XgXoL7g0rF