Wall Street Memes (WSM/USD) Trade Waxes, Surging Volatility
Estimated Reading Time: 3 minutes
Don’t invest unless you’re prepared to lose all the money you invest. This is a high-risk investment and you are unlikely to be protected if something goes wrong. Take 2 minutes to learn more
Wall Street Memes Price Prediction – May 17
A demonstration of energy-prevalence style has been seen exhibited by the WSM/USD market bulls against most attempted selling moves, just as the financial trade line shows that the crypto-economic trade presently waxes, surging volatility.
Gradually, market behavior is exhibiting a sustained bias toward episodic upward displacements, consistently diverging from the lower bounds of the middle and lower Bollinger Bands trend structures. In this context, long-term position holders are increasingly incentivized to persist with catalyst-driven accumulation strategies aimed at structurally rebuilding the foundational layers of the broader crypto economy.
WSM/USD Market
Key Levels
Resistance levels: $0.0015, $0.002, $0.0025
Support levels: $0.0005, $0.0004, $0.0003
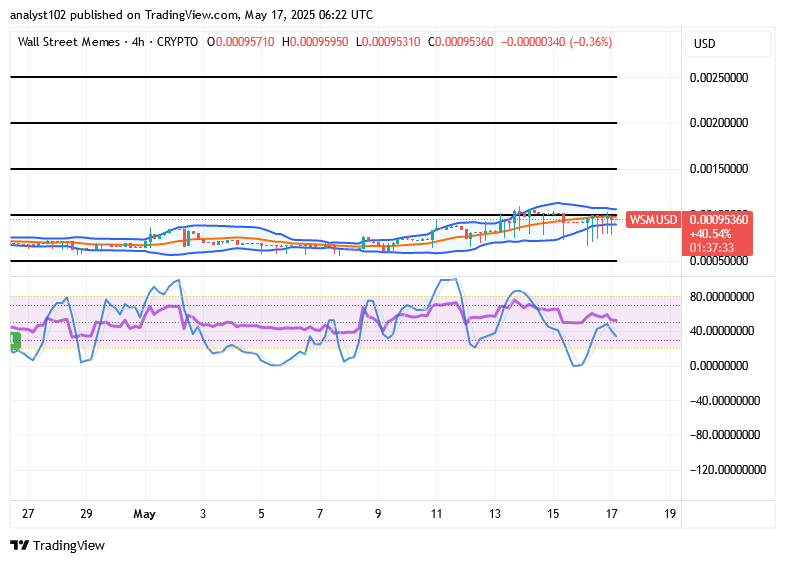
WSM/USD – 4-hour Chart
The WSM/USD 4-hour chart shows that the crypto-economic trade is currently waxing with surging volatility.
The stochastic oscillators are merely turning to the south side around points built at 40, tending to signify that a short dipping process might yet surface for a period of time. The Bollinger Bands have been struggling to stretch relatively east-north across the zones of $0.001.
Is there potential for the indecision phase to unfold while the WSM/USD market stabilizes near $0.001?
The WSM/USD market’s activity is likely to encounter additional pit stops around the $0.001 trade line, especially if both primary market movers fail to initiate decisive action, as the current financial backdrop indicates the trade is waxing with surging volatility.
On balance, considering the observable dynamics in the comparative behavior of both trading instruments, it remains a credible thesis that long-term capital allocators are strategically positioned to accumulate greater base valuation relative to its counterpart, in anticipation of structurally driven potential rebounds within forthcoming market cycles.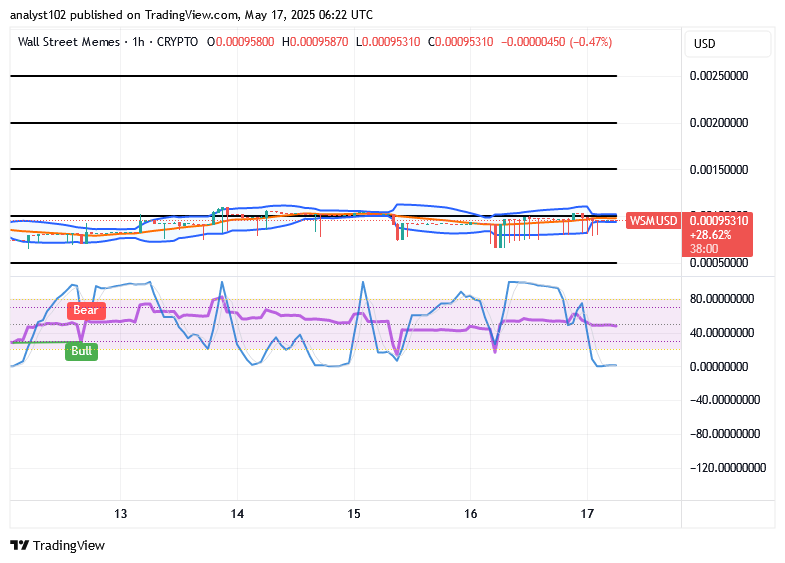
WSM/USD 1-hour chart
The 1-hour chart reveals that crypto-economic price is currently waxing with surging volatility.
The stochastic oscillators, while currently in the oversold region, offer a promising signal encouraging cautious optimism rather than shorting at this point. The Bollinger Bands’ trend lines reveal a healthy volatility compression within a clearly defined, structured price channel. Overall, this setup strongly favors continued bullish momentum and positive price adherence near the upper range trade zones.
BIGTIMEUSDT & WSMUSDT Contracts now live on Bybit — trade them with leverage today!
🚀 BIGTIMEUSDT & WSMUSDT Contracts now on Bybit!
— Bybit (@Bybit_Official) October 12, 2023
Dive into new trading opportunities with 1-25x leverage. Plus, they’re now on Bybit Futures Grid Bot! Start trading now.
📈 BIGTIME: https://t.co/FAQlbhnzAh
📈 WSM: https://t.co/pb2y2AfMBE#CryptoTrading #Bybit