$SPONGE (SPONGE/USD) Gains Momentum Just Shy of Critical $0.005 Mark
Estimated Reading Time: 3 minutes
Don’t invest unless you’re prepared to lose all the money you invest. This is a high-risk investment and you are unlikely to be protected if something goes wrong. Take 2 minutes to learn more
As the bear market for $SPONGE concludes, following a rebound from the bullish support zone, market activity has stabilized, reflecting a balance between demand and supply at this level. The occurrence of a flat price action at this critical support level implies a potential reversal of the preceding bearish trend.
This is substantiated by the emergence of notably stronger and more pronounced candlesticks evident in the recent 4-hour trading sessions. The heightened bullish momentum, indicated by the robust candlesticks, suggests a shift in market sentiment and hints at the conclusion of the bearish phase.
Key Market Dynamics:
- Resistance Levels: $0.0010, $0.0011, and $0.0012.
- Support Levels: $0.00040, $0.00035, and $0.00030.
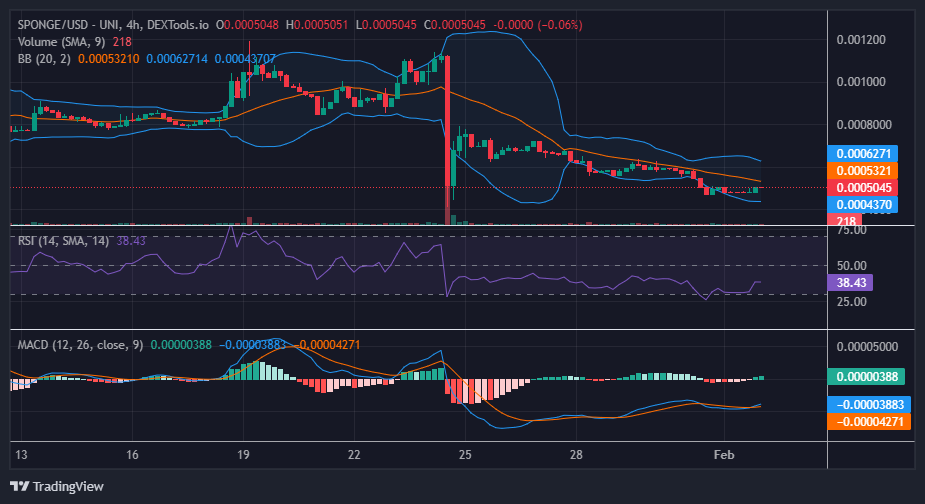
Comprehensive Technical Analysis for $SPONGE (SPONGE/USD)
The influence of bullish sentiment persists amidst the prevailing bear market. Following a substantial decline in market prices on January 24, a bullish response ensued during the subsequent four-hour session on the same day. However, the bullish momentum was limited, failing to surpass the $0.0008 price level. Subsequently, the $SPONGE market initiated a prolonged downward movement, reaching the $0.0005 price.
As selling pressure continues, some traders may anticipate a slight dip below the critical $0.0005 price level. Subsequently, the market entered a phase of consolidation as opposing forces balanced out. Although indicators still indicate robust bearish momentum, historical data underscores the $0.00045 and $0.0005 levels as a bullish support zone. Consequently, there is an expectation that prices may rebound from this zone.
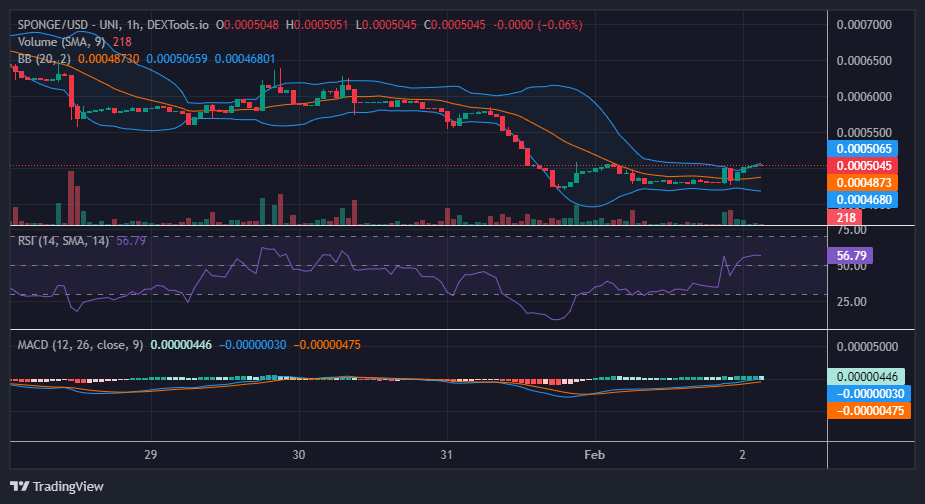
Insights from the 1-Hour Perspective:
The tenacity of bullish traders becomes evident in the 1-hour chart analysis. Notably, the price exhibited a period of consolidation precisely around the support level, followed by a sudden and substantial upward movement, indicative of a bullish trend. The price action has led to a contraction of the price channel, with a notable stabilization around the $0.0005 mark. Although this suggests a degree of market indecision, a promising development for bullish traders is observed in the Bollinger Bands.
The recent surge in bullish price action has prompted a divergence in the Bollinger Bands, offering a positive signal amidst the uncertainty. This divergence indicates a potential bullish breakout in the near future. Traders may find optimism from this crypto signal, but continued vigilance and monitoring of the evolving market dynamics are advisable for a comprehensive understanding of the potential bullish trend.
Settle your $SPONGE tokens quickly to avoid the discontinuation of #SPONGE V1!
🚨 Only 3 days left! 🚨
Hurry and stake your $SPONGE tokens now before #SPONGE V1 is discontinued!
Withdraw your SPONGE V1 tokens from exchanges and stake them through our website before the 5th of February to be able to claim #SPONGEV2! 🧽#MemeCoin #Crypto #Web3 #Staking pic.twitter.com/uMWnJ7JPY9
— $SPONGE (@spongeoneth) February 2, 2024
Invest in the hottest and best meme coin. Buy Sponge ($SPONGE) today!