Arbitrum Price Prediction: ARB Stumbles Again After Touching $1.15
Estimated Reading Time: 3 minutes
Don’t invest unless you’re prepared to lose all the money you invest. This is a high-risk investment and you are unlikely to be protected if something goes wrong. Take 2 minutes to learn more
Arbitrum Price Prediction – November 12
The Arbitrum price prediction shows that ARB may fall below the 21-day moving average if it touches the support of the $1.11 level.
ARB/USD Long-term Trend: Ranging (Daily Chart)
Key levels:
Resistance Levels: $1.40, $1.50, $1.60
Support Levels: $0.95, $0.85, $0.75
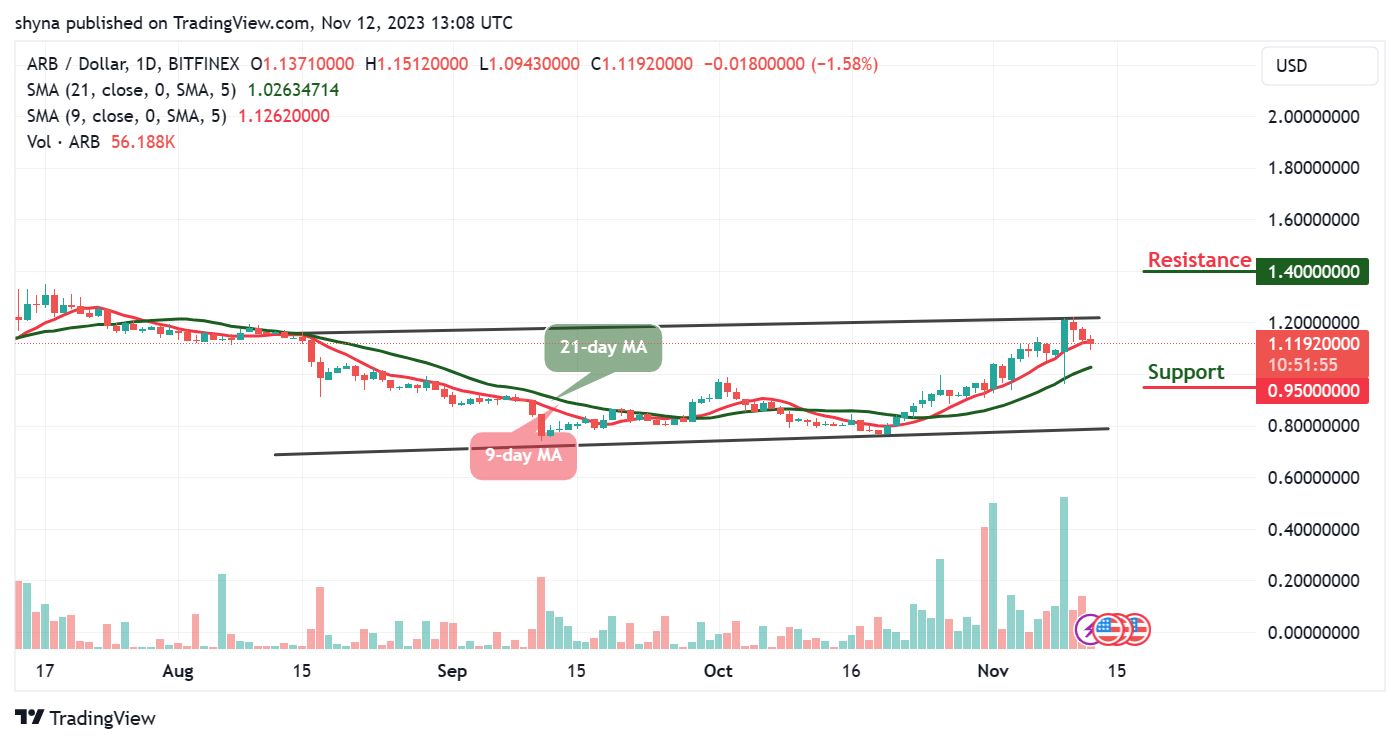
The daily chart reveals that ARB/USD may claim more support as the coin moves within the channel with the current consolidation pattern. However, as the coin fails to cross above the upper boundary of the channel, ARB/USD may likely see a sharp drop towards the lower boundary of the channel. Moreover, the nearest support may be located at $1.10. Beneath this, other supports could be found at $0.95, $0.85, and $0.75.
Arbitrum Price Prediction: Arbitrum (ARB) May Head to the South
The Arbitrum price has failed to break above the resistance level at $1.20, the coin may set up another few days of negative price declines beneath $1.11 but a break above the 9-day moving average could allow the coin to touch the resistance level of $1.30. Meanwhile, the 9-day MA is still above the 21-day MA, suggesting that the market may head to the north.
Nevertheless, the Arbitrum price touched the daily low of $1.09 but may create another support level below the 9-day moving average. However, it does look like bears may end up closing below this support. On the contrary, if the coin crosses above the channel, resistance levels could be located at $1.40, $1.50, and $1.60.
ARB/USD Medium-term Trend: Bullish (4H Chart)
The 4-hour chart shows that the Arbitrum price is following the bearish movement as the coin slides below the 9-day and 21-day moving averages. Although the Arbitrum price has not yet crossed below the daily low of $1.11, it’s likely to create move downtrends once it breaks below the support level of $1.10.
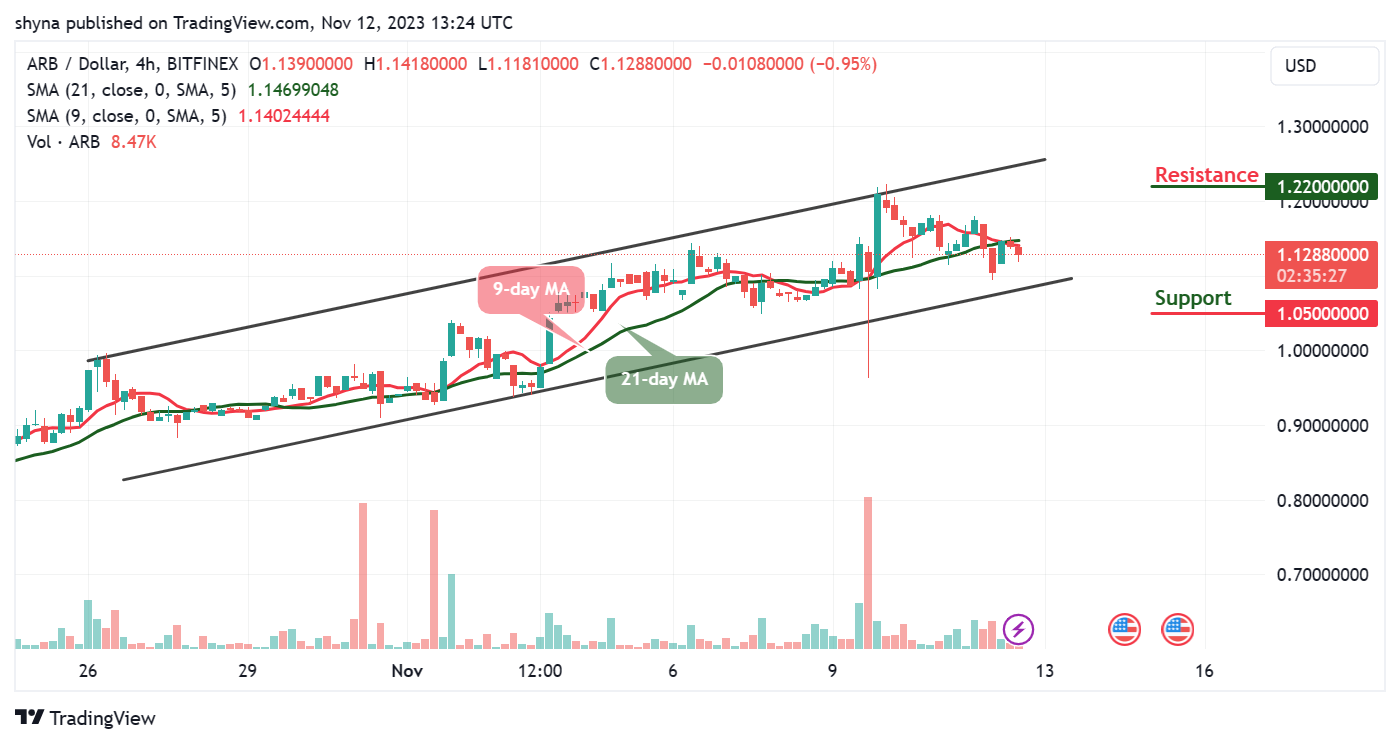
At the moment, ARB/USD is bearish but any upward movement toward the upper boundary of the channel could push the price to the nearest resistance at $1.22 and above while the immediate support lies at $1.05 and below. The 9-day MA is crossing below the 21-day MA, suggesting that the market may head to the south.
Place winning Arbitrum trades with us. Get ARB here