Polygon (MATIC/USD) Trade Swings Up, Tending to Pause
Estimated Reading Time: 3 minutes
Don’t invest unless you’re prepared to lose all the money you invest. This is a high-risk investment and you are unlikely to be protected if something goes wrong. Take 2 minutes to learn more
Polygon Price Prediction – January 28
Falling motions have been featured over a couple of long sessions, predominantly since the Polygon market failed to move upward past $1.10, given that the trade sings up, tending to pause around the trade zone of the middle Bollinger Band.
Examining the middle Bollinger Band’s trade spot seems to be the best crypto signal place for short-position placers to recover around the indicators’ midpoint. If buyers appear to be losing steam around the middle Bollinger Band trade zone, there is a chance that the price will briefly change and move back towards its previous lower swinging force zone, which is around $0.70. Nonetheless, the investing process can go forward without any concerns.
MATIC/USD Market
Key Levels:
Resistance levels: $0.90, $0.95, $1
Support levels: $0.70, $0.65, $0.60
MATIC/USD – Daily Chart
The MATIC/USD daily chart showcases the crypto-economic trade swings up from around the point of $0.70, tending to pause below $0.90.
The Bollinger Band indicators are slightly placed southerly to portend a bullish flag pattern, with the lower side denoting a firmer baseline around the value of $0.70. The stochastic oscillators have been, over time, managing to get repositioned while pushing northward at a higher point. A reversal tending to make a stable bearish candlestick below the upper part of the Bollinger Band will see a selling force resorting to a force of depression.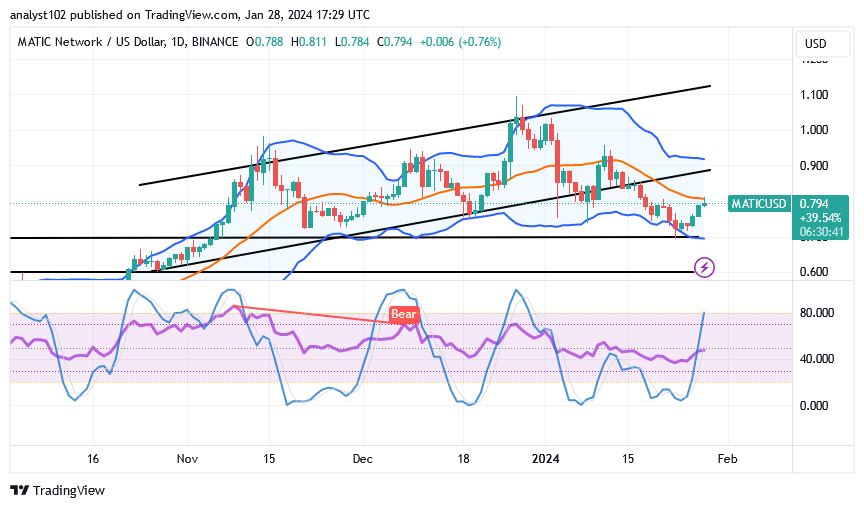
When the price trades around $0.794, will a long-holding scenario at the middle Bollinger Band cause the reversion to resume?
A long-holding condition of the MATIC/USD market is liable to give birth to a systemic reversion mode as the crypto market swings up, tending to pause the movements around the line of $0.80.
Purchasing activity could need to keep rising above the most recent bullish candlestick formations that emerged from the lower Bollinger Band zone. In order to move fearfully further north, long-position takers must concentrate their efforts around the existing zone.
An examination of the gravitational forces in place now supports the emergence of bulls. Meanwhile, given that the price is now hovering around $0.80, a move to indicate busy trading might temporarily allow a shorting cycle to control the market’s pace.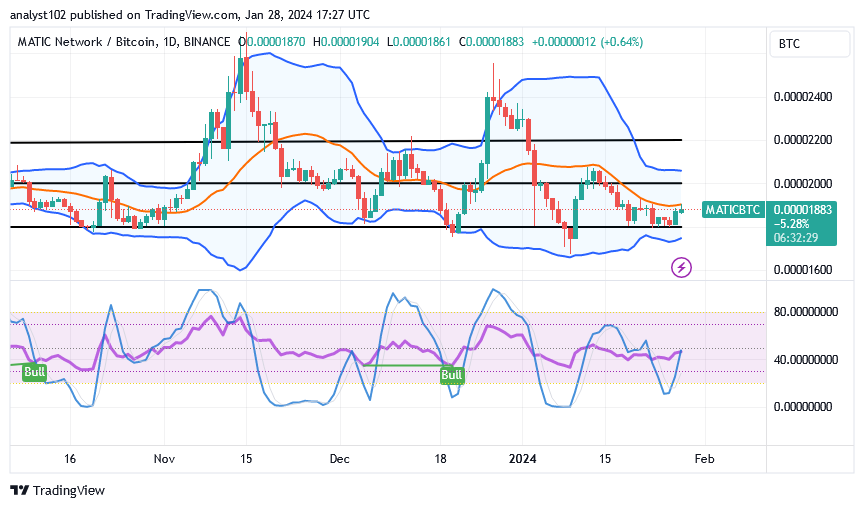
MATIC/BTC Price Analysis
In comparison, the Polygon trade swings up from around the lower Bollinger Band, tending to pause around the middle Bollinger Band.
While seeing an optimal higher place where the base cryptocurrency seems to lose momentum, the stochastic oscillators have been veering. The points between the middle and upper sides may be formed by the Bollinger Band trend lines. As it is, the base instrument is working harder than its counterpart, albeit at a slower rate of capacity.
Note: Cryptosignals.org is not a financial advisor. Do your research before investing your funds in any financial asset or presented product or event. We are not responsible for your investing results.
You can purchase Lucky Block here. Buy LBLOCK