Polygon (MATIC/USD) Trade Is Lowering, Rebuilding a Baseline
Estimated Reading Time: 3 minutes
Don’t invest unless you’re prepared to lose all the money you invest. This is a high-risk investment and you are unlikely to be protected if something goes wrong. Take 2 minutes to learn more
Polygon Price Prediction – January 14
Activities of bulls in the market operations of Polygon versus the purchasing weight of the US coin have been over a couple of sessions put under a check that has led the current bargaining actions to lowering and rebuilding a baseline between the paths of the upper and lower Bollinger Bands.
The stochastic oscillators are going to be instrumental in the determination process of when the price is potentially going to bounce back into an uprising motion. Buyers should now exercise caution in light of the possibility of erratic price drops versus the lower Bollinger Band near the $0.75 mark. That being said, should that scenario materialize, Traders will have another excellent opportunity to get ready to pay close attention to the dip purchasing process, even though it might take some time before they see a desired rebound.
MATIC/USD Market
Key Levels:
Resistance levels: $0.95, $1.05, $1.15
Support levels: $0.75, $0.70, $0.65
MATIC/USD – Daily Chart
The MATIC/USD daily chart showcases that the crypto-economic price is lowering, rebuilding a baseline above the lower Bollinger Band.
The Bollinger Band trend lines are systemically positioned northward to depict the values of $1.10 and $0.80 as the key resistance and support, respectively. The stochastic oscillators are having a slight southbound-crossing mode on the blue part to indicate that a fall is tentatively ongoing.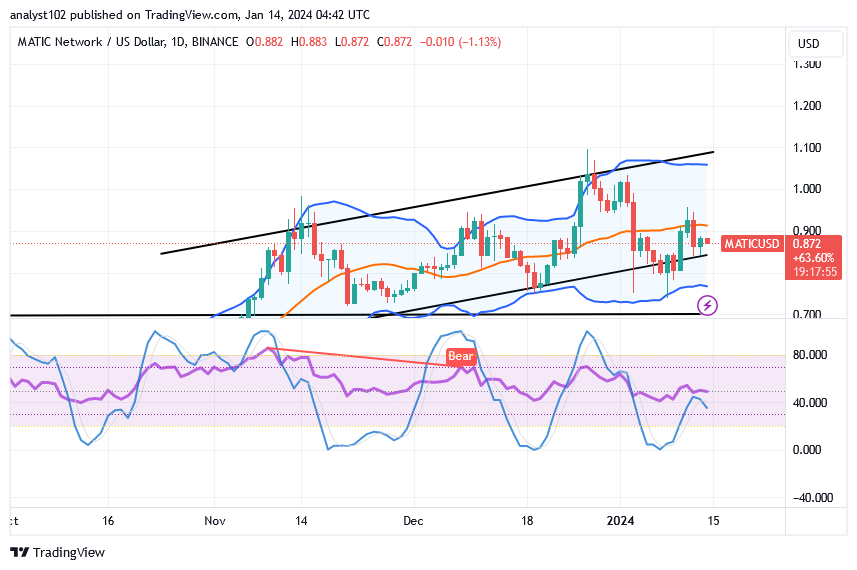
As the price hovers around $0.872, which indicator should buyers of MATIC/USD trades follow?
The ideal technical trade indicator that buyers in the market operations of MATIC/USD are expected to follow has to be stochastic oscillators with the formation of a bullish candlestick to back up an ideal execution of a longing entry order, given that the price is lowering, rebuilding a baseline.
Before the market can resume its upward trajectory to the north, a slow motion force has been causing it to visit some of its final lower points. Bulls may be kept in check for a bit below the middle Bollinger Band in the interim, as a bouncing pattern is anticipated to emerge soon.
The stochastic oscillators’ repositioning indicates that there will likely be more declines below the $0.95 resistance line for some time. Right now, it seems like sellers are trying to drive the price back down toward $0.80 or even $0.75.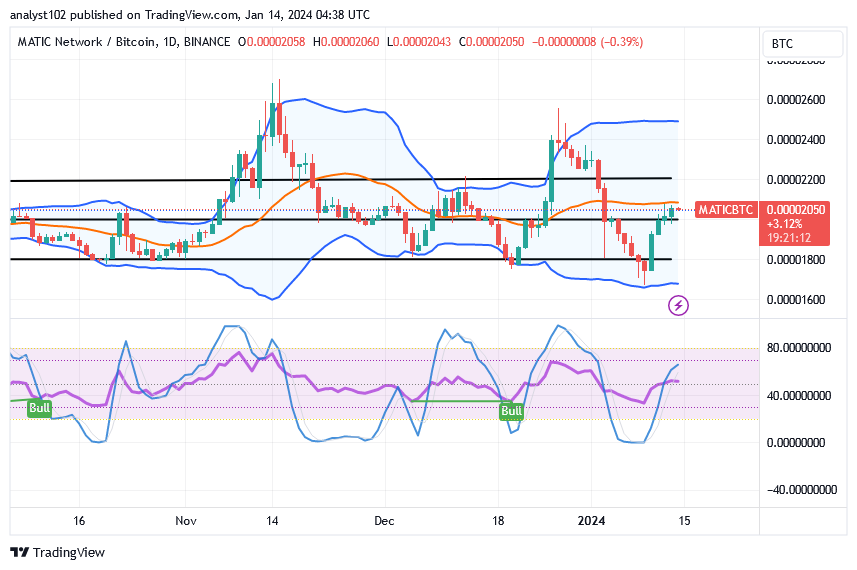
MATIC/BTC Price Analysis
In comparison, the Polygon market is preparing to lower before rebuilding energy against the velocity of Bitcoin around the point of the middle Bollinger Band.
The Bollinger Band trend lines are yet to be widely opened to showcase wider range-bound zones.. The fact that there are certain clearly staged higher and lower positions are telling. The stochastic oscillators maintain a rising mode as they approach larger pushing-through values. In relation to the cryptocurrency used for countertrading, the base coin is trending south. The motion for an uprising will probably be postponed.
Note: Cryptosignals.org is not a financial advisor. Do your research before investing your funds in any financial asset or presented product or event. We are not responsible for your investing results.
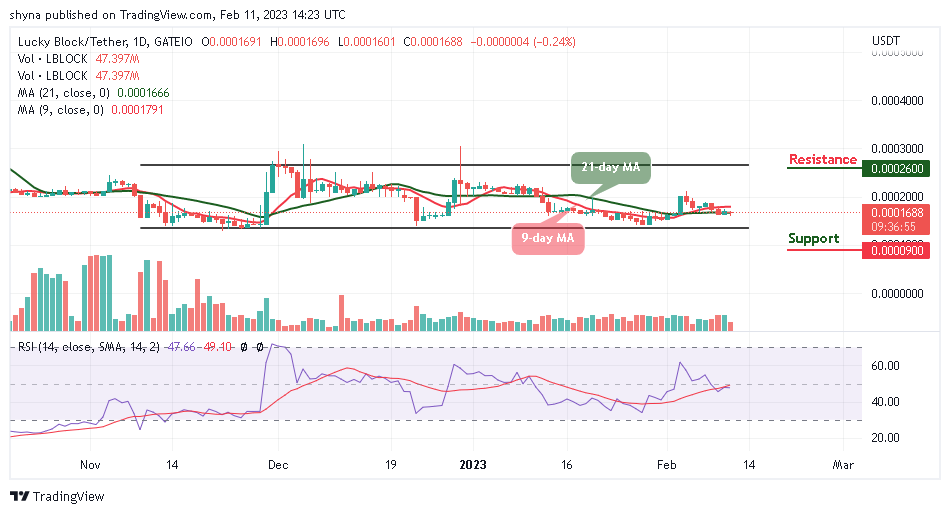
You can purchase Lucky Block here. Buy LBLOCK