Polygon (MATIC/USD) Price Goes Lower, Rebuilding Swigging Input
Estimated Reading Time: 4 minutes
Don’t invest unless you’re prepared to lose all the money you invest. This is a high-risk investment and you are unlikely to be protected if something goes wrong. Take 2 minutes to learn more
Polygon Price Prediction – January 7
Selling activities to mark the considerable dropping force to back up the normal correctional motions to produce a formidable entry point to commence a re-buying process have been made in the market operations of Polygon versus the US coin, given that the cryptocurrency’s trade price goes lower, rebuilding swigging input around the point of $0.80.
As of today’s operations, a candlestick signifying a buying motion has been surfacing in the middle of the lower and middle Bollinger Band trend lines. The bullish trend line in the bottom channel has been constructed to indicate the critical support line, which long-position traders need to be aware of when accepting orders for positive positions. The downside of the trade has been set up so that bulls can begin to find ways to recover from the current trading position of $0.841 and prevent further drops.
MATIC/USD Market
Key Levels:
Resistance levels: $0.95, $1.05, $1.15
Support levels: $0.75, $0.70, $0.65
MATIC/USD – Daily Chart
The MATIC/USD daily chart reveals the crypto market goes lower beneath the point of $0.90, rebuilding swigging input above $0.70.
The upper and lower Bollinger Band trend lines, at $1.10 and $0.70, respectively, have stayed oriented northward. The main areas where ups and downs have been present have been those points. The falling force has been elevated by the stochastic oscillators, who have entered the oversold area, to the point where sellers may take a chance on extending it further in the next activity.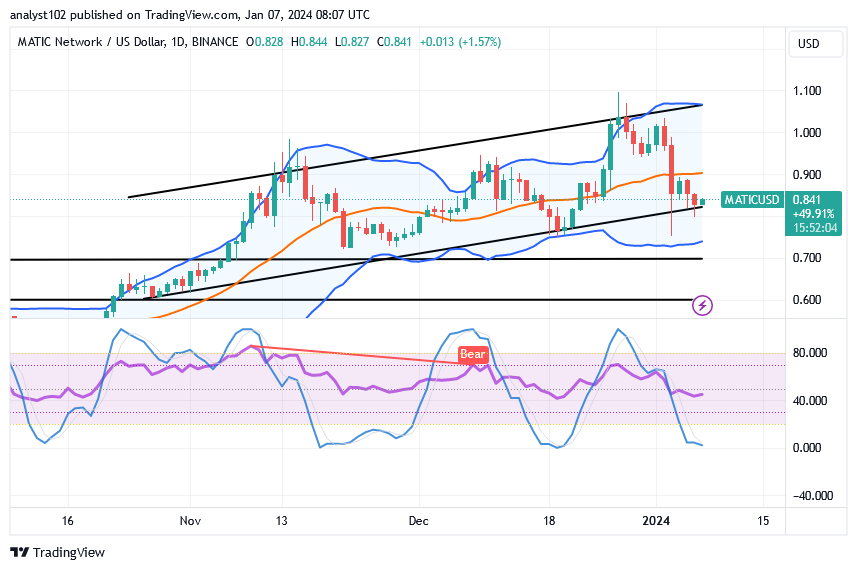
Should we expect the MATIC/USD trade bears to push southerly more against the line of $0.80 in the near future?
The MATIC/USD market short-position takers are likely not going to resort to a consolidation motion against the point of $0.80, as the trade situation currently has it that the price goes lower, rebuilding swigging input.
Given that oscillators have signaled an oversold position, it would theoretically be unethical to pursue further shorting actions against the $0.80–$0.75 range. We encourage sellers to cease executing new shorting positions in light of the note. Any attempts to press below the $0.80 mark and beyond will not result in steady movements.
Sellers would find it challenging to continue pressing below the lower Bollinger Band trend line values at this point. Bears are cautioned against entering more short positions until a different moment suggests that an overbought condition has been reached at the upper Bollinger Band. We believe that the $1.20 line is where that assumption needs to be observed.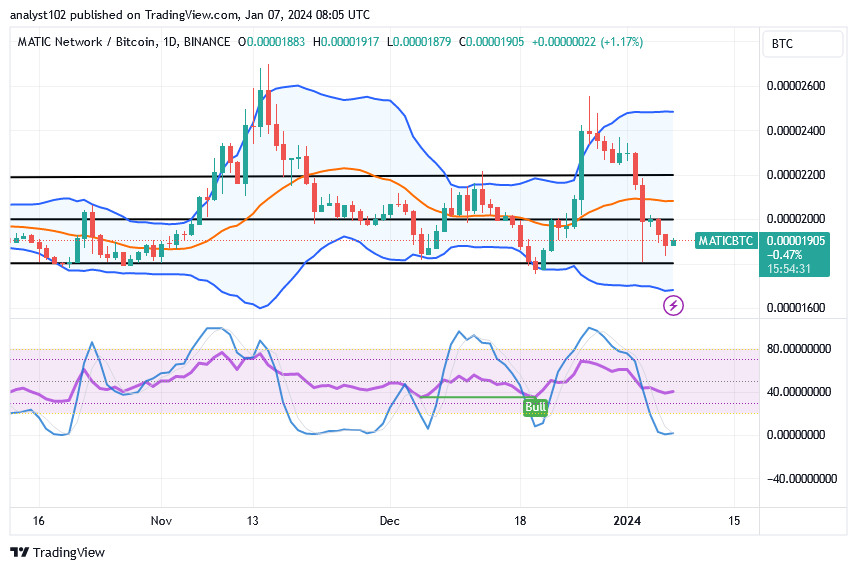
MATIC/BTC Price Analysis
In comparison, the Polygon trade is going lower, pairing with the trending ability of Bitcoin, rebuilding swigging inflow.
The path of candlesticks featuring indicators has been brought down to revisit lower zones where the base cryptocurrency tends to build up all back from the lower zones of the Bollinger Bands. The stochastic oscillators have dipped their blue line into the oversold region, swinging the par upward from the lower point. There is a bullish candlestick forming, which could indicate a rebounding sign.
Note: Cryptosignals.org is not a financial advisor. Do your research before investing your funds in any financial asset or presented product or event. We are not responsible for your investing results.
You can purchase Lucky Block here. Buy LBLOCK