Origin Protocol (OGN/USD) on the Rise: Can It Reach Its 2024 Peak?
Estimated Reading Time: 3 minutes
Don’t invest unless you’re prepared to lose all the money you invest. This is a high-risk investment and you are unlikely to be protected if something goes wrong. Take 2 minutes to learn more
The Origin Protocol market has been on an upward trajectory since last year, characterized by subtle yet consistent progress. However, upon reaching significant resistance levels, the market experienced heightened volatility, leading to a period of sideways price movement as bearish forces responded to the encroaching bullish sentiment.
Nevertheless, following these periods of consolidation, the market has consistently broken out into new upward zones. This pattern has repeated itself approximately four times since the inception of the market’s upward journey.
Origin Protocol Market Data
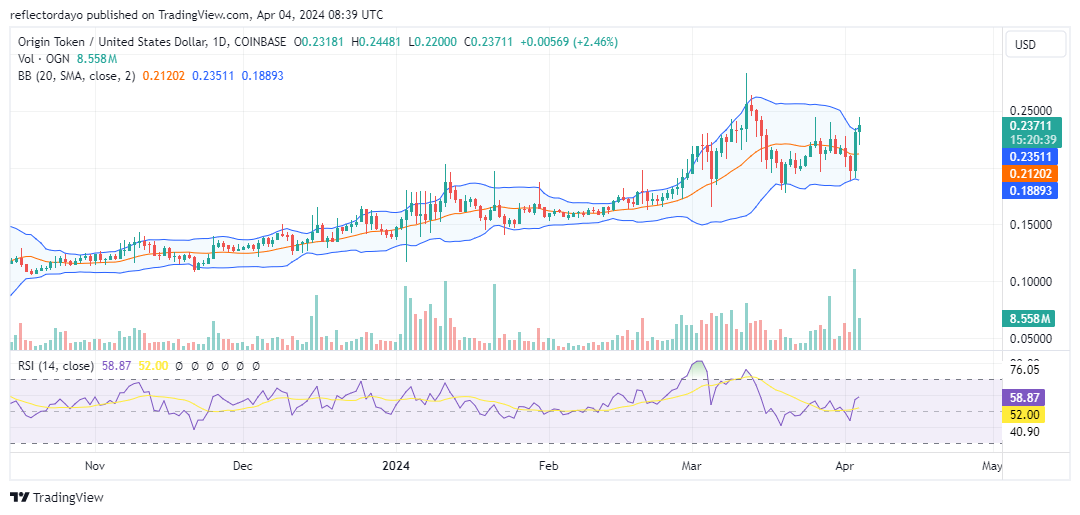
- OGN/USD Price Now: $0.2375
- OGN/USD Market Cap: $137 million
- OGN/USD Circulating Supply: 577 million
- OGN/USD Total Supply: 1 billion
- OGN/USD CoinMarketCap Ranking: #395
Key Levels
- Resistance: $0.25, $0.28, and $0.30.
- Support: $0.20, $0.15, and $0.10.
Origin Protocol Market Analysis: The Indicators’ Point of View
Drawing upon the historical data of this market, one can assess the current dynamics of the Origin Protocol market by analyzing its past behavior. Following a breakout above the $0.165 price level and a subsequent surge beyond $0.20, bullish momentum intensified, propelling the price even higher, surpassing $0.25. However, as traders began to take profits, bearish sentiment emerged, leading to a temporary reversal.
Despite this, the prevailing bullish sentiment became evident as the $0.20 price level established itself as a pivotal support, guiding the market back towards $0.25. Throughout March, the market maintained a sideways range within a defined bandwidth, mirroring the pattern observed in the Bollinger Bands.
While the resilience of the bulls, particularly evident at the $0.20 price level, is notable, traders should exercise caution, considering a subtle shift in the resistance level from $0.25 to $0.24. This slight adjustment may signal a potential reversal or the likelihood of further consolidation around the $0.20 threshold.
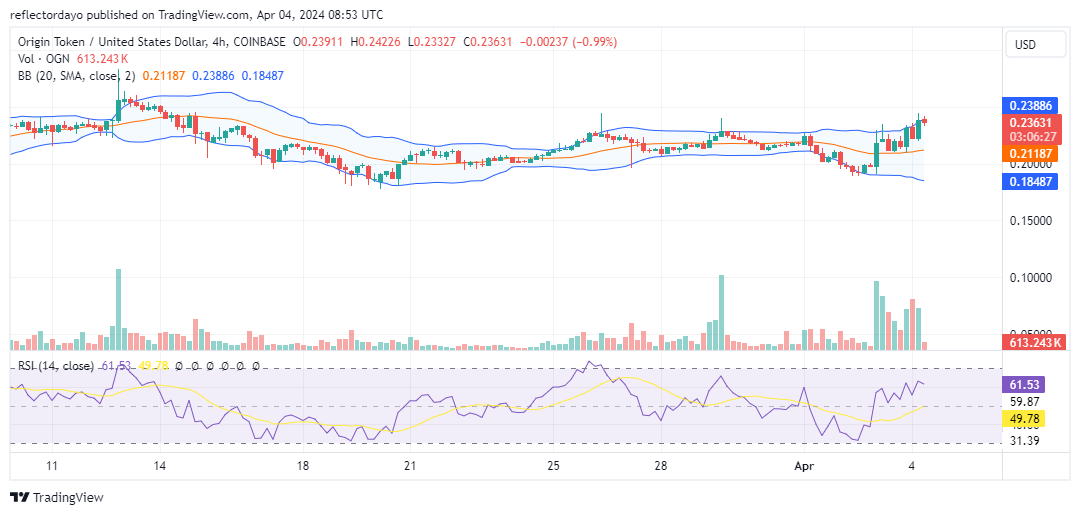
OGN/USD 4-Hour Chart Outlook
Presently, on the 4-hour chart, the Bollinger Bands indicate elevated volatility, characterized by diverging bands. However, there is a notable decline in trading volume, suggesting the potential for market stability either above or below the horizontally moving 20-day moving average.
Moreover, the Relative Strength Index indicates a bullish bias, with the momentum favoring bulls at a level of 60. This crypto signal suggests that the market may consolidate horizontally, albeit at a price level above $0.20.