Lucky Block Price Prediction: LBLOCK/USD Moves For A Bullish Shoot
Estimated Reading Time: 3 minutes
Don’t invest unless you’re prepared to lose all the money you invest. This is a high-risk investment and you are unlikely to be protected if something goes wrong. Take 2 minutes to learn more

Free Crypto Signals Channel
The Lucky Block price prediction shows that LBLOCK will form higher as the coin prepares for a bullish movement.
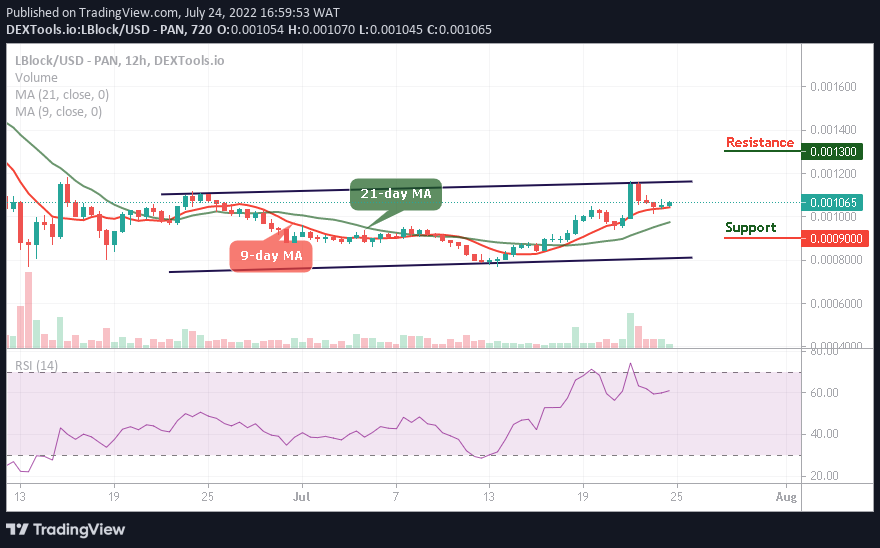
LBLOCK/USD Medium-term Trend: Ranging (12H Chart)
Key Levels:
Resistance levels: $0.0013, $0.0015, $0.0017
Support levels: $0.0009, $0.0007, $0.0005
LBLOCK/USD is ranging as the market price prepares for a bullish movement towards the upper boundary of the channel. Meanwhile, the bulls are gathering momentum to push the coin above the resistance level of $0.0012. However, should the bulls fail to make the price upward, the Lucky block price may consolidate for a while.
Lucky Block Price Prediction: LBLOCK/USD Will Move Higher
The Lucky Block price will break to the upside if the bulls regroup and strengthen the market. Any further bullish movement across the upper boundary of the channel may take the Lucky Block price to the resistance levels of $0.0013, $0.0015, and $0.0017.
On the contrary, this analysis may be incorrect if the bears bring the market price below the 9-day and 21-day moving averages, this may cause the coin to hit the supports at $0.0009, $0.0007, and $0.0005. Similarly, the technical indicator Relative Strength Index (14) is moving above 60-level to prepare the coin for the upside.
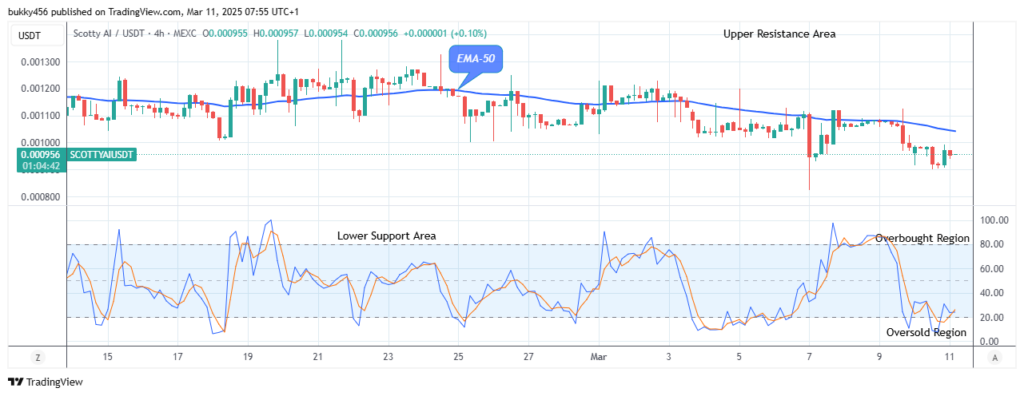
LBLOCK/USD Medium-term Trend: Ranging (4H Chart)
On the 4-hour chart, the Lucky Block price is hovering above the 9-day and 21-day moving averages. The coin will move towards the channel’s upper boundary as soon as the bulls strengthen the market. However, if the buyers push the price above the channel, higher resistance could be located at $0.0013 and above.
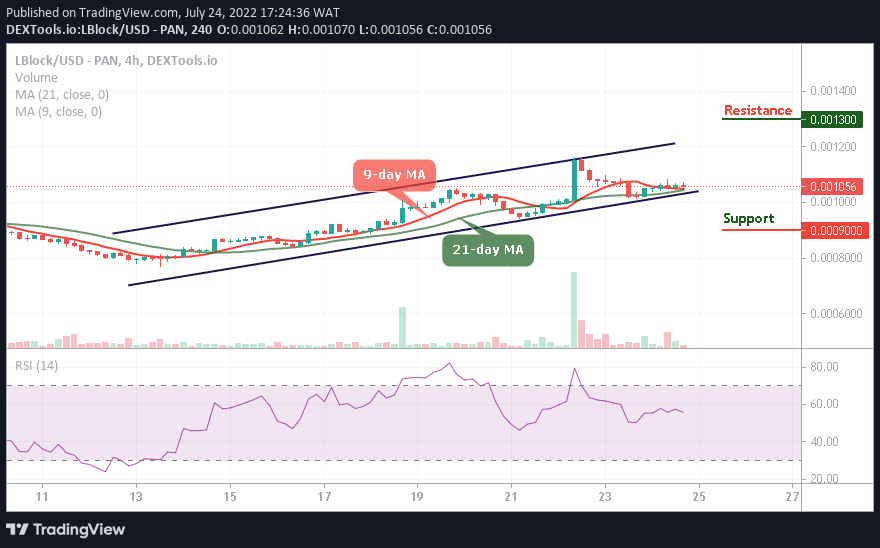
Meanwhile, the technical indicator Relative Strength Index (14) is moving to cross above the 60-level, indicating that the coin may move sideways before heading to the north. Moreover, should the bulls fail to move the current market value to the upside, the bears may step into the market, and the nearest support level could be found at $0.0009 and below.
You can purchase Lucky Block here. Buy LBLOCK