Jito (JTO/USD) Surges to New ATH: Above $4.00 and Soaring to $5.16
Estimated Reading Time: 3 minutes
Don’t invest unless you’re prepared to lose all the money you invest. This is a high-risk investment and you are unlikely to be protected if something goes wrong. Take 2 minutes to learn more
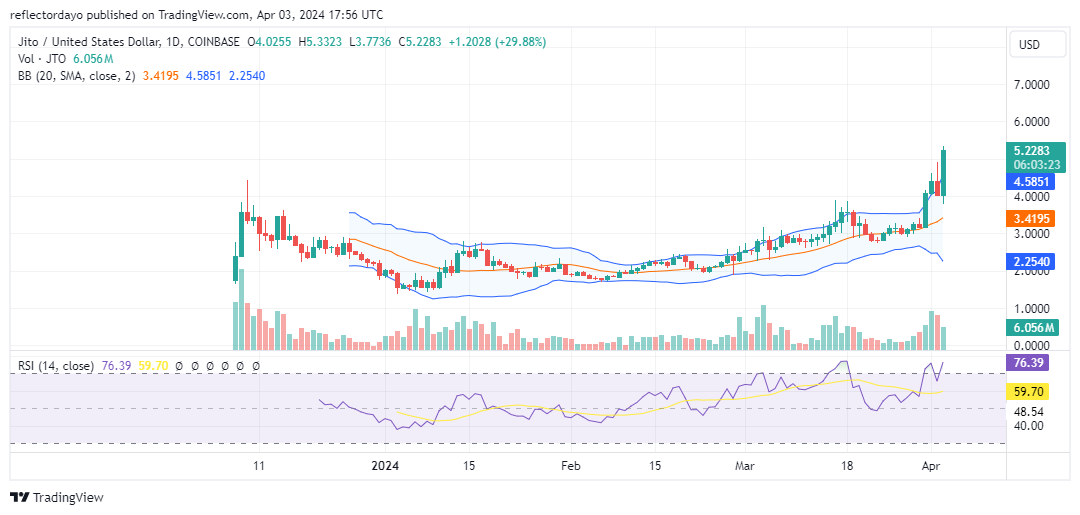
The $4.00 price level holds significant importance within the Jito market. On March 31, a notable surge in price ensued due to the activities of Jito bullish traders, propelling the market towards the $4.00 price threshold. This robust bullish movement coincided with an increase in volatility, likely emboldening bullish investors to surpass this price threshold.
Jito Market Data
- JTO/USD Price Now: $5.2144
- JTO/USD Market Cap: $ 612 million
- JTO/USD Circulating Supply: 117 million
- JTO/USD Total Supply: 1 billion
- JTO/USD CoinMarketCap Ranking: #131
Key Levels
- Resistance: $5.50, $6.00, and $6.50.
- Support: $4.00, $3.50, and $3.00.
Jito Market Analysis: The Indicators’ Point of View
The bullish activity in the market has heightened market volatility, as evidenced by the divergence of the Bollinger Bands indicator. This increased volatility has made the bears more formidable at the key $4.00 price level, although the bulls have displayed dominance (according to this crypto signal) by pushing the price beyond $5.00. Moreover, the bull market has established the $4.00 price level as a support level, further underscoring the bullish sentiment prevailing in the market.
Nevertheless, the divergence of the Bollinger Bands and the overbought condition of the market suggest a potential correction in the near future. The high market volatility could amplify this correction, potentially eroding the gains made by the bulls. However, if the bulls can maintain their stronghold at the $4.00 price level, they are likely to continue their upward trajectory.
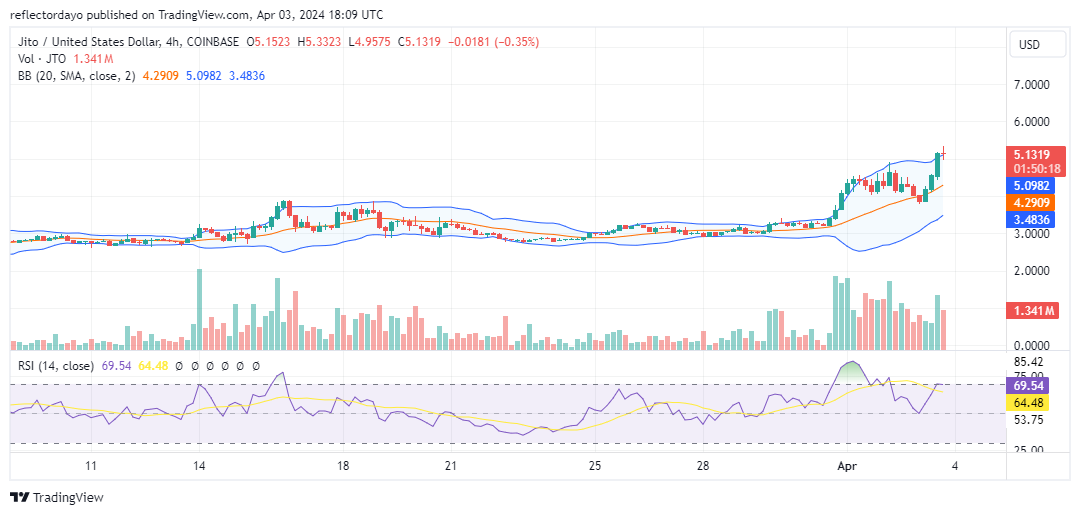
JTO/USD 4-Hour Chart Outlook
The analysis of the smaller timeframe chart indicates an uptrend in the price channel, characterized by a significant bandwidth observed through the Bollinger Bands indicator. Bulls maintain strong dominance in the market, driving prices upward. This bullish momentum has propelled the market into the $5.00 price zone. However, bearish pressure is notable at this level, as evidenced by the formation of a long-legged doji candlestick. The ongoing struggle between bulls and bears at this threshold aims to establish a new support level, which would provide the bulls with an added advantage for further upward momentum. However, if the bulls fail to sustain this level, the ensuing correction could be equally significant to the recent bullish movement, with the $4.00 price level potentially assuming a pivotal support role in the market.