Litecoin (LTC/USD) Bounces Back, Finds Support Above $100
Estimated Reading Time: 2 minutes
Don’t invest unless you’re prepared to lose all the money you invest. This is a high-risk investment and you are unlikely to be protected if something goes wrong. Take 2 minutes to learn more
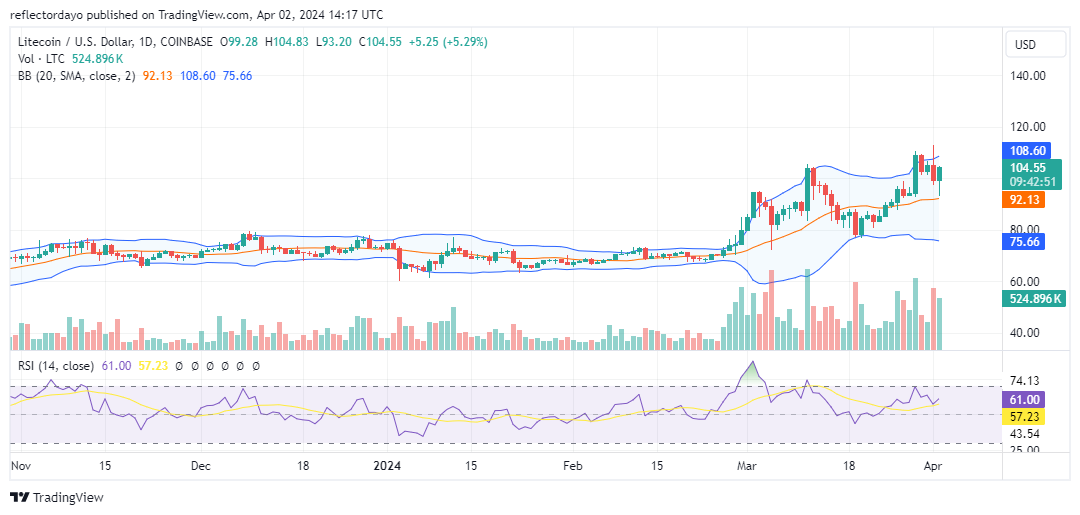
Our recent Litecoin market analysis, published on March 29th, identified a consistent uptrend characterized by two consecutive higher highs. As anticipated, the price reached a third higher high of $110 on that same day. However, three days later, a price rejection at $113 signaled a potential reversal and increased bearish pressure. This resulted in a shift in market dynamics, with bulls successfully converting the previous resistance level of $100 into a new support level.
Litecoin Market Data
- LTC/USD Price Now: $106
- LTC/USD Market Cap: $7.9 billion
- LTC/USD Circulating Supply: 74 million
- LTC/USD Total Supply: 84 million
- LTC/USD CoinMarketCap Ranking: #19
Key Levels
- Resistance: $113, $115, and $120.
- Support: $90, $85, and $80.
Litecoin Market Analysis: The Indicators’ Point of View
The recent defense of the $100 support level suggests that bulls may hold some short-term strength. However, the decisive rejection at $113 during yesterday’s trading session indicates potential resistance from bears. While Bollinger bands currently suggest sideways movement, the upward divergence of the upper band highlights increasing bullish momentum. This, combined with the high volatility within the Litecoin market, could indicate that bears are strategically utilizing this volatility to test the $113 resistance.
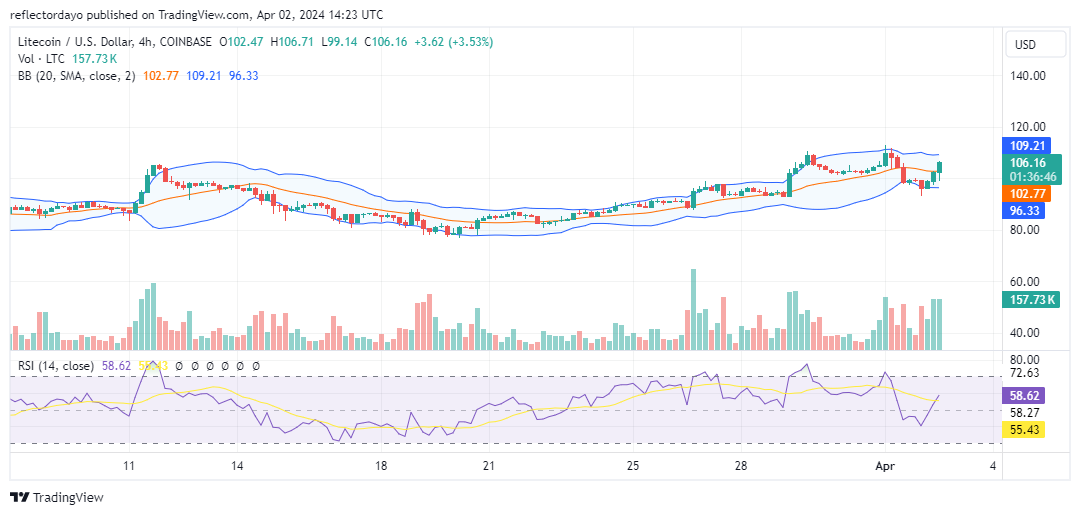
LTC/USD 4-Hour Chart Outlook
A potential resistance zone around $113 could see bulls attempt to solidify their control at the current support level. This tug-of-war between bulls and bears might lead to a contraction of the Bollinger Bands, signifying a decrease in volatility. This crypto signal often precedes a significant price movement, although the direction remains uncertain.