Near Protocol (NEAR/USD): Demand and Supply Near Equilibrium at $7.00
Estimated Reading Time: 2 minutes
Don’t invest unless you’re prepared to lose all the money you invest. This is a high-risk investment and you are unlikely to be protected if something goes wrong. Take 2 minutes to learn more
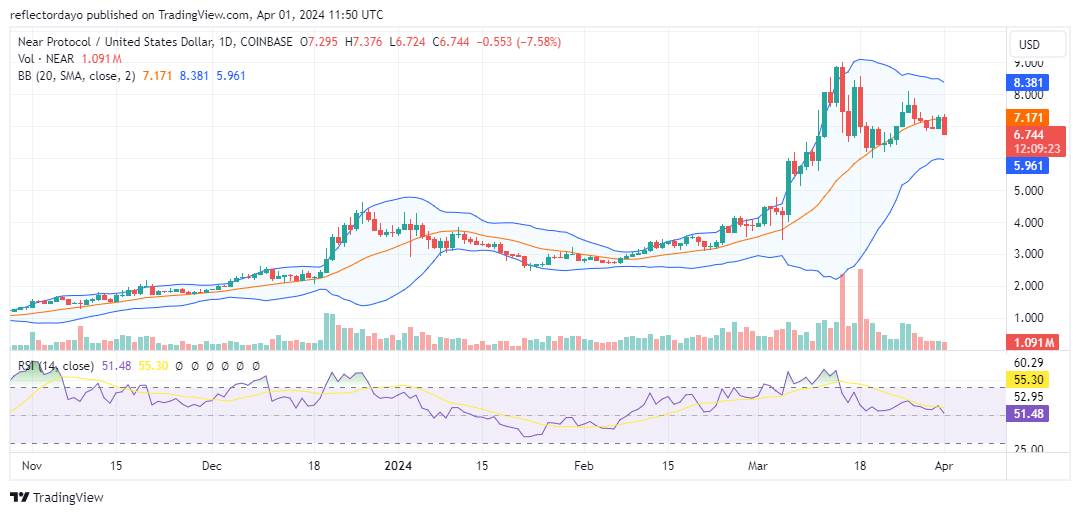
During March, a wave of bullish sentiment swept through the Near Protocol market, initiating a pronounced uptrend that began in late February. As prices neared the $9.00 mark, volatility surged, presenting bears with lucrative opportunities. This led to a consolidation phase spanning from $7.00 to $9.00. Yet, bulls showcased their resilience by holding support levels below $7.00, effectively challenging the prevailing bearish sentiment. Their tenacity seemed to wear down the bears, evident in the subsequent shift of support levels surpassing $7.00.
Near-Protocol Market Data
- NEAR/USD Price Now: $6.72
- NEAR/USD Market Cap: $7.2 billion
- NEAR/USD Circulating Supply: 1.1 billion
- NEAR/USD Total Supply: 1.2 billion
- NEAR/USD CoinMarketCap Ranking: #21
Key Levels
- Resistance: $8.00, $8.50, and $9.00.
- Support: $6.50, $6.00, and $5.50.
Near Protocol Market Analysis: The Indicators’ Point of View
The indicators suggest a potential consolidation phase. The Bollinger Bands are converging around the $7.00 price level, indicating a decrease in the volatility of the Near Protocol market, which often precedes a clear directional movement. However, the Relative Strength Index (RSI) shows a significant decline, nearing the 50 level, suggesting weakening momentum. This crypto signal could potentially signal bullish intervention around the $6.50 price level.
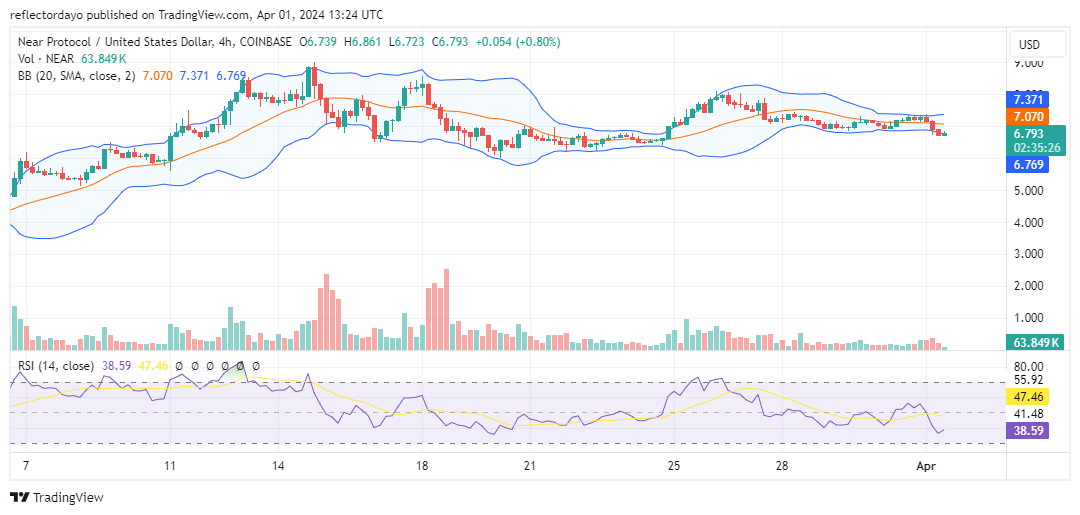
NEAR/USD 4-Hour Chart Outlook
From a 1-hour chart perspective, the market maintains a trajectory near the $7.00 mark. However, bearish pressure is evident as the price action remains below the 20-day moving average, with a tendency towards the $6.50 level. While traders exhibit a willingness to buy, there is a higher probability of the market descending towards the $6.50 price level.