Polygon (MATIC/USD) Market Swings Up, Contemplating a Reversal
Estimated Reading Time: 4 minutes
Don’t invest unless you’re prepared to lose all the money you invest. This is a high-risk investment and you are unlikely to be protected if something goes wrong. Take 2 minutes to learn more
Polygon Price Prediction – December 24
Transaction lines between the resistances of $1 and $0.90 have remained the basic higher zones where the MATIC/USD market bulls’ capacity has been exhausted over a period of time, given that the crypto trade swings up, contemplating a reversal movement.
Buyers were unable to push their positions closer to the upper Bollinger Band trend line; therefore, a small correcting motion resumed running into two days. The lower support zone around $0.70 serves as a safety net against more probable scary lows in the event of a worst-case trade occurrence. The lower Bollinger Band trend line has maintained its positioning posture around the $0.75 mark. Long-position placers shouldn’t waste time starting a dip purchasing strategy, even with that assumption.
MATIC/USD Market
Key Levels:
Resistance levels: $1, $1.05, $1.10
Support levels: $0.75, $0.70, $0.65
MATIC/USD – Daily Chart
The MATIC/USD daily chart showcases the crypto-economic trade swings up after finding support above the point of $0.70, contemplating a reversal beneath the point of $0.90.
The stochastic oscillators are positioned a bit at the top of 40, portending that the blue line is planning to move back to the downside. The Bollinger Band trend lines are tentatively placed northward to showcase that the trade spot of $0.80 tends to be the main determining value of the current forces being exhibited in the market.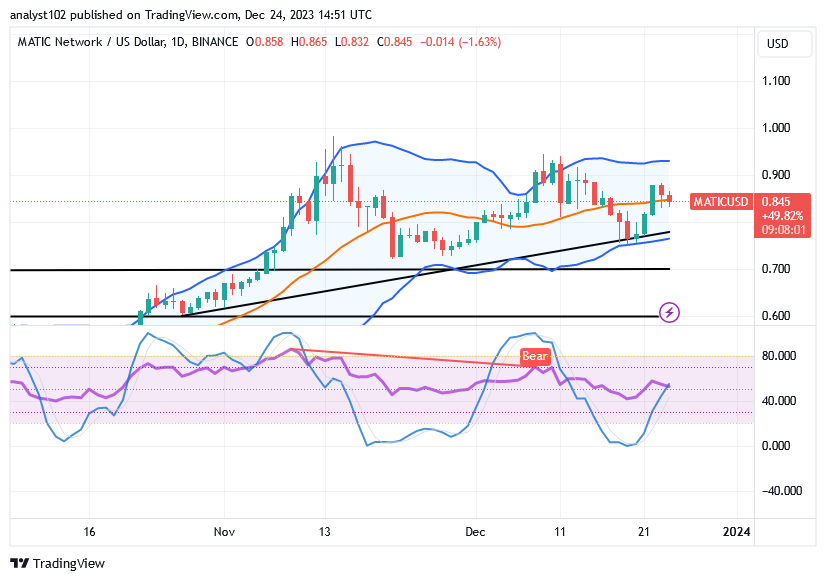
In the MATIC/USD market operation, which indicator’s posture should traders focus on the most when making a position decision?
The repositioning of the stochastic oscillators either in the oversold or overbought regions will have to draw the attention of traders most while they are thinking of launching a position order, as the MATIC/USD trade swings up, contemplating a reversal motion below the line of $0.90.
Before that assumption can be fulfilled, there needs to be some patience in order to restore the oscillators’ prepositional stance. Buyers should be aware of the impending strong comeback and leverage their return to average the upper Bollinger Band trend line, given the recent reduction in price movement.
Activities that indicate a continuation of the current downward trend should be controlled by the barrier that exists between the $0.90 mark and the upper Bollinger Band trend line. the finalization of the decreasing pressures required to push in the direction of or around the lower Bollinger Band line.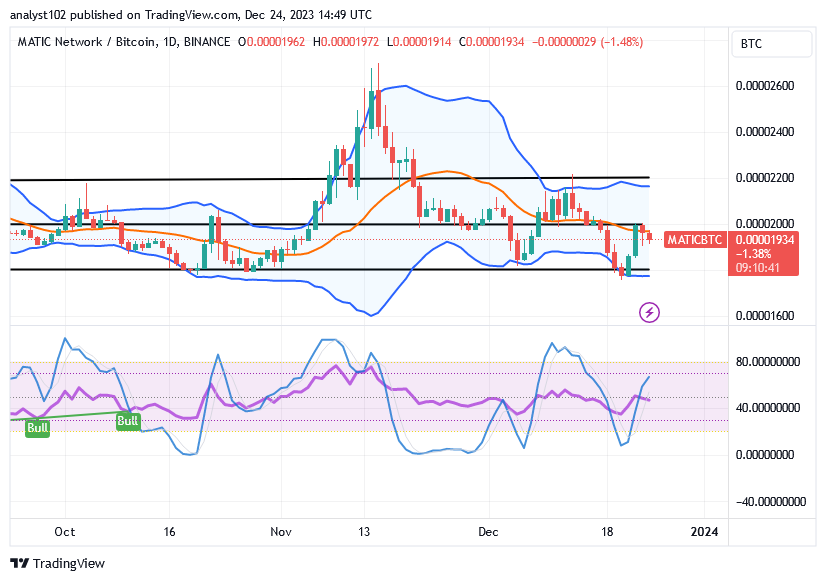
MATIC/BTC Price Analysis
In comparison, the Polygon trade swings up to touch the middle Bollinger Band against the point of Bitcoin, contemplating a reversal.
Bollinger Band trend lines have been found to be systemically positioned over a number of sessions, indicating that the trade condition has been built on a footstep toward guaranteeing that the majority of lows give way back to a comeback index. The base cryptocurrency is currently in a position to give its counter-crypto economy more momentum, as shown by the stochastic oscillators. However, it doesn’t seem like a long line is moving southward.
Note: Cryptosignals.org is not a financial advisor. Do your research before investing your funds in any financial asset or presented product or event. We are not responsible for your investing results.
You can purchase Lucky Block here. Buy LBLOCK