Polygon (MATIC/USD) Price Shifts Down, Planning a Base
Estimated Reading Time: 3 minutes
Don’t invest unless you’re prepared to lose all the money you invest. This is a high-risk investment and you are unlikely to be protected if something goes wrong. Take 2 minutes to learn more
Polygon Price Prediction – December 12
There has been a systemically upward moving force that has once propelled the valuation of Polygon versus the worth of the US dollar to the point of $0.90, given the cryptocurrency trade shifts down to plan a base.
The velocity depressions that have been occurring on the downward shift have logically been decreasing, approaching the $0.80 line as of the writing of this analysis. The crucial underlying support can be seen in the long term near the $0.70 line. Investors are advised to start contributing their cash specifically for the significant increases that are anticipated to occur in the upcoming months, as we have seen some climbs in the majority of long-term rising cryptocurrencies in the interim.
MATIC/USD Market
Key Levels:
Resistance levels: $0.95, $1.05, $1.15
Support levels: $0.70, $0.65, $0.60
MATIC/USD – Daily Chart
The MATIC/USD daily chart showcases the cryptocurrency shifting down, planning a base around the trending axis of the middle Bollinger Band indicator.
The Bollinger Band indicators are strategically positioned to keep bullish-trading zones around the values of $0.90 and $0.70. The stochastic oscillators have slightly crossed southbound to place tightly closer to the point of 40. There has been a slight positive pressure on the current formation of the candlestick in the making to denote that buyers are gradually recomposing their stances in the crypto economy.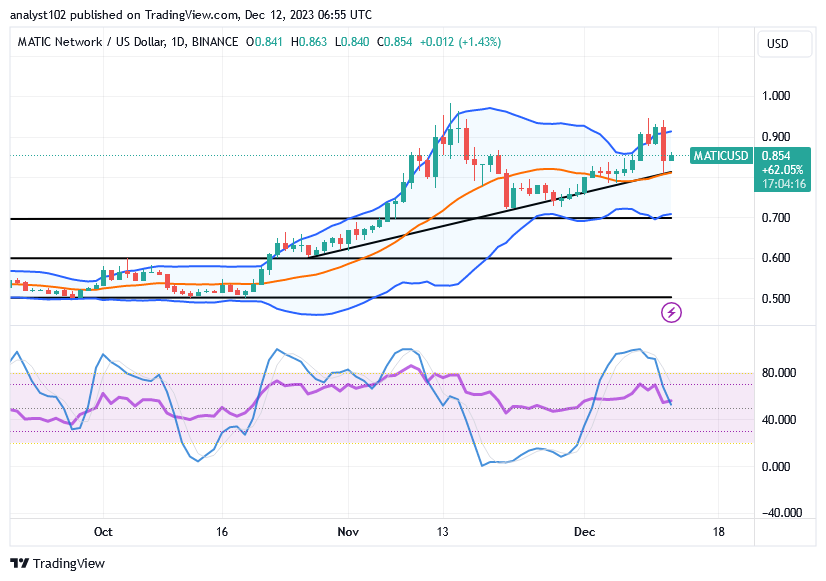
Now that the oscillators are positioned around 40, should buyers in the MATIC/USD market hold off on re-entering the market?
During yesterday’s bargaining session, a bearish candlestick emerged from the upper resistance spot of the Bollinger Band around the point of $0.90, given the MATIC/USD price shifts down, planning a base around $0.80.
The middle Bollinger Band’s support for the bullish trend line has been the center of the uprising forces’ production. Even if the price still needs to drop to the lower bound of the Bollinger Bands, execution of long-standing position orders is anticipated to stage more and more in the next few hours.
Using the upper Bollinger Band trend line, bears should have executed sell orders around the $0.90 mark. Bears should not allow any energy-regaining system that bulls may intend to negate the falling path that has been created by the emergence of yesterday’s bearish candlestick at this point in trade.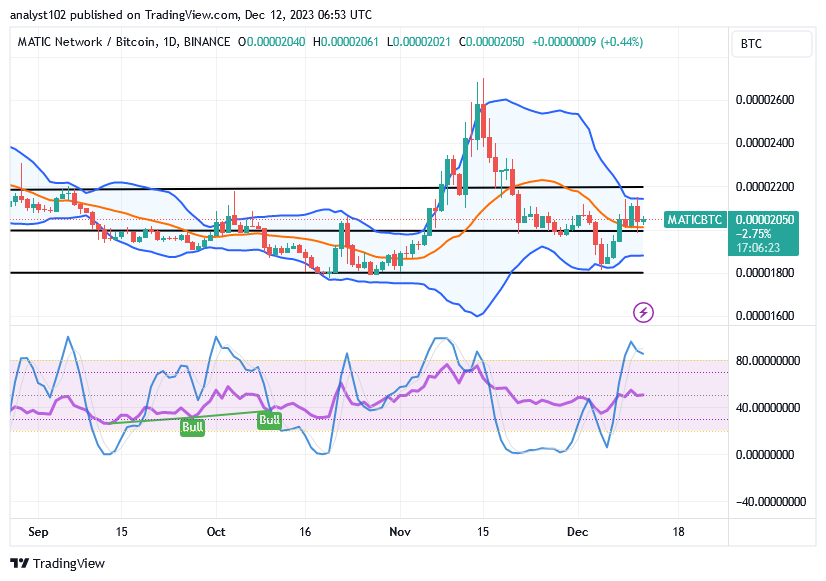
MATIC/BTC Price Analysis
In comparison, the Polygon trade shifts down in succumbing to the pressure of Bitcoin, planning a base around the middle Bollinger band trend line.
The blue line of the stochastic oscillators is in the overbought area, indicating that the price may take longer to reposition itself for the base inside the Bollinger Bands. Wide-range trading areas are maintained at significantly lower places using the Bollinger Band indicators. The entire technical analysis reveals that the quotient cryptocurrency coin is headed for rapid decline relative to the base instrument.
Note: Cryptosignals.org is not a financial advisor. Do your research before investing your funds in any financial asset or presented product or event. We are not responsible for your investing results.
You can purchase Lucky Block here. Buy LBLOCK