Bitcoin Cash (BCH/USD) Relaxes at a $900 Price Level in Its Current Recovery Movement
Estimated Reading Time: 3 minutes
Don’t invest unless you’re prepared to lose all the money you invest. This is a high-risk investment and you are unlikely to be protected if something goes wrong. Take 2 minutes to learn more
Bitcoin Cash Price Prediction – April 30
Lately, the BCH/USD market valuation went down for a price correction and, in the recent upswing for a rebound, the crypto now experiences a kind of pit stop around the level of $900.
BCH/USD Market
Key Levels:
Resistance levels: $100, $1,100, $1,200
Support levels: $750, $650, $550
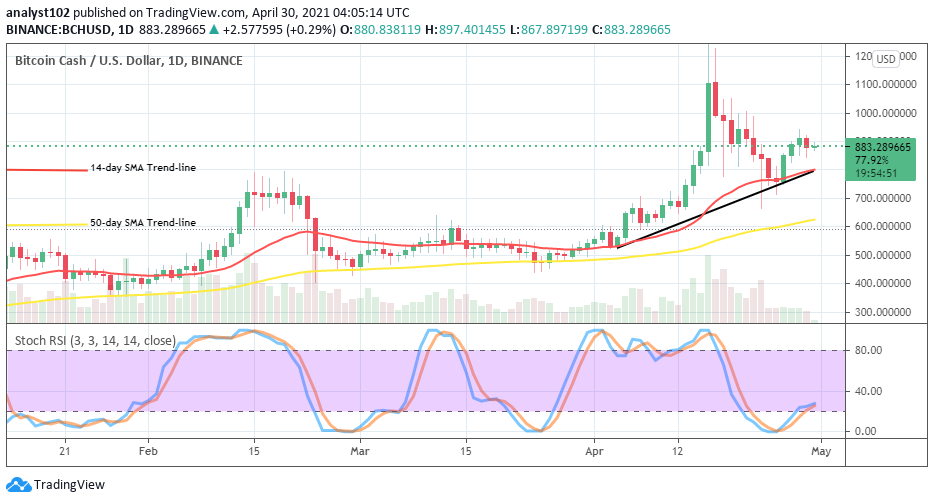
BCH/USD – Daily Chart
After the emergence of a bullish candlestick o April 26 promising a strong sign of price rallies, the BCH/USD daily chart has now revealed a pause around the value of $900 by featuring two smaller candlesticks. As of writing today, the third one is in the making. But, only the end of today’s sessions will tell how it will go. There is a visible space between the two SMAs. The 14-day SMA trend-line is located above the 50-day SMA indicator. The Stochastic Oscillators have slantingly placed between the overbought region and range 30 seemingly trying to close the hairs at it. That signifies the possibility of getting to see some less-active movements in the crypto-economy very soon.
Could the $900 point eventually turn into a tough resistance trading level?
The BCH/USD current price recovery move has made to face a slight resistant trading moment around the main level of $900 for a while. If it is deemed necessary, a small length of correction may as well occur seeing the market pushes down back to re-find support around $800 or $750 levels at a more downward-active move in the BCH/USD operations.
On the downside, bears may cautiously have to be on the lookout for a strong reversal move around the present resistant trading zone to launch a decent sell entry. However, the expectation at that level doesn’t back short-position to be left for a long time without applying the principles of money management. The market levels of $800 and $700 could the areas of settling the trap for the BCH/USD bears.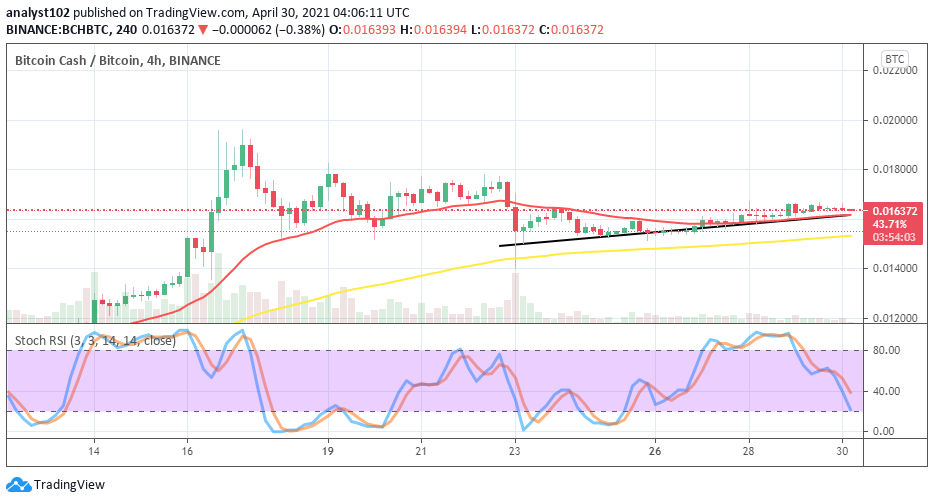
BCH/BTC Price Analysis
Weighing the market worth between BCH and BTC, the base crypto seems to be facing variant resistances imposed on it by the counter trading instrument. Nevertheless, Bitcoin Cash still to some extent relatively posses a weightier value as depicted on the chart. The 14-day SMA trend-line is located over the 50-day SMA. And, they both slightly point toward the north-east to align with the present market condition. The Stochastic oscillators now appear unwittingly to have traveled down towards range 20. That could at a later session lead to signaling a return of prevailing catalyst by the base crypto at the expense of its counter trading tool.
Note: cryptosignals.org is not a financial advisor. Do your research before investing your funds in any financial asset or presented product or event. We are not responsible for your investing results.