0x (ZRXUSD) Price Plays Hide and Seek at the Moment
Estimated Reading Time: 3 minutes
Don’t invest unless you’re prepared to lose all the money you invest. This is a high-risk investment and you are unlikely to be protected if something goes wrong. Take 2 minutes to learn more
ZRXUSD Analysis – The Price Currently Shows No Clear Movement
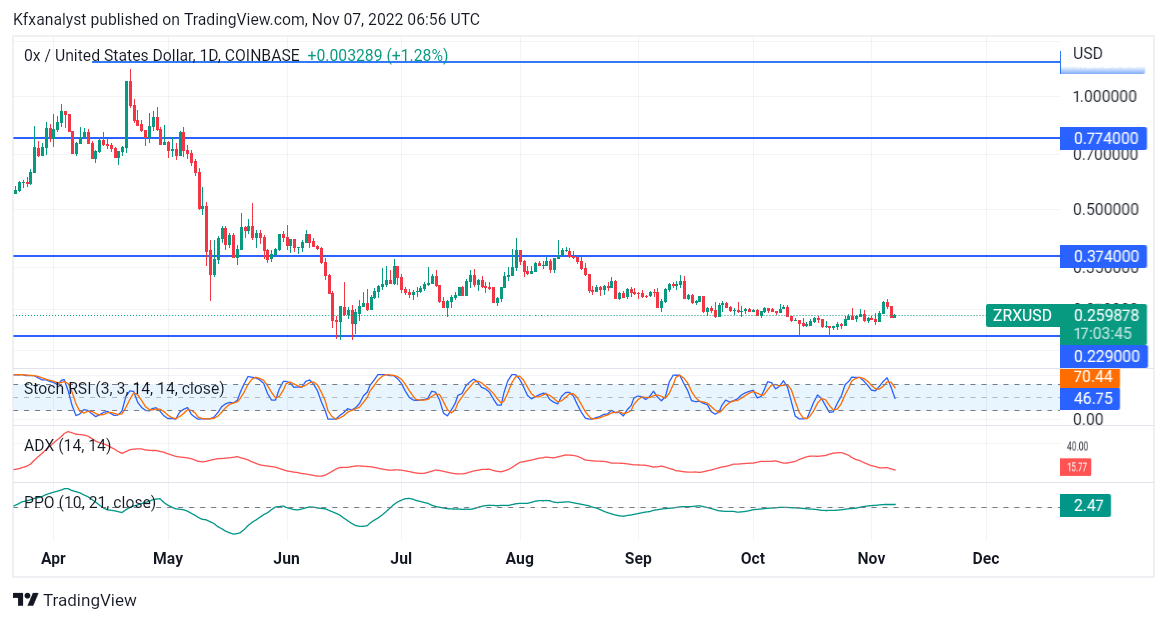
ZRXUSD price plays hide and seek at the moment as no clear growth is seen. The market has played out to be declining previously at some point. However, buyers were also seen trying to change prices as the market direction took place. No major influence has been felt on the ZRXUSD for a long time, and traders have been longing for big movers to change price direction, thereby giving it a smoother path to follow. The daily chart shows buyers pulling strength back from selling action as the stochastic cross indicator indicates the price is likely to still fall.
ZRXUSD Market Levels
Resistance Levels: $0.77400, $1.24000
Support Levels: $0.37400, $0.22900
The big traders have caused so much of the drop as the price moment was dropped at the order level block of $1.24000, a key zone in the market. As traders continued to pump price activity lower, numerous key zones were broken in the market. A big move was also seen when the price broke through the $0.77400 key level and made its decline to the $0.37400 key zone. The price began holding up in the $0.37400 key zone after a short period of accumulation in the market.
ZRXUSD’s extension down to the $0.22900 key zone gave rise to price accumulation in the market. The crypto price hasn’t gotten a clear direction with the market’s consolidation. The crypto price hasn’t gotten a clear direction with the market’s consolidation. The Average Daily Range indicator still shows price strength and a selling tendency on the daily chart. This implies that sellers will have the upper hand to go lower as prices remain unstable at the moment. Taking a look at the price oscillator indicator, there is also no clear trading direction in the market.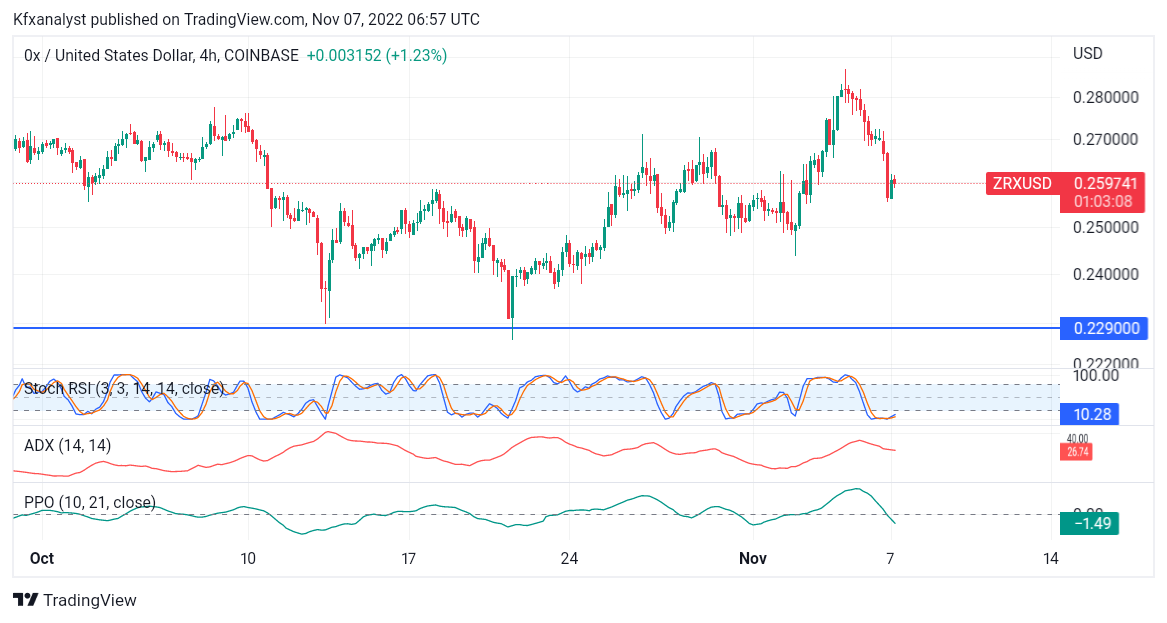
Market Expectation
The sellers are offering price flow lower on the 4-hour chart time frame. The price activity is displayed to be trending lower as the crypto market enters its consolidation phase. Traders should still project selling displays back to the $0.22900 key zone.
You can purchase Lucky Block here. Buy LBLOCK
Note: Cryptosignals.org is not a financial advisor. Do your research before investing your funds in any financial asset or presented product or event. We are not responsible for your investing results.