BNTUSD Continues Downward Along the Major Trendline
Estimated Reading Time: 2 minutes
Don’t invest unless you’re prepared to lose all the money you invest. This is a high-risk investment and you are unlikely to be protected if something goes wrong. Take 2 minutes to learn more
BNTUSD Analysis: Price continues downward along the major trendline
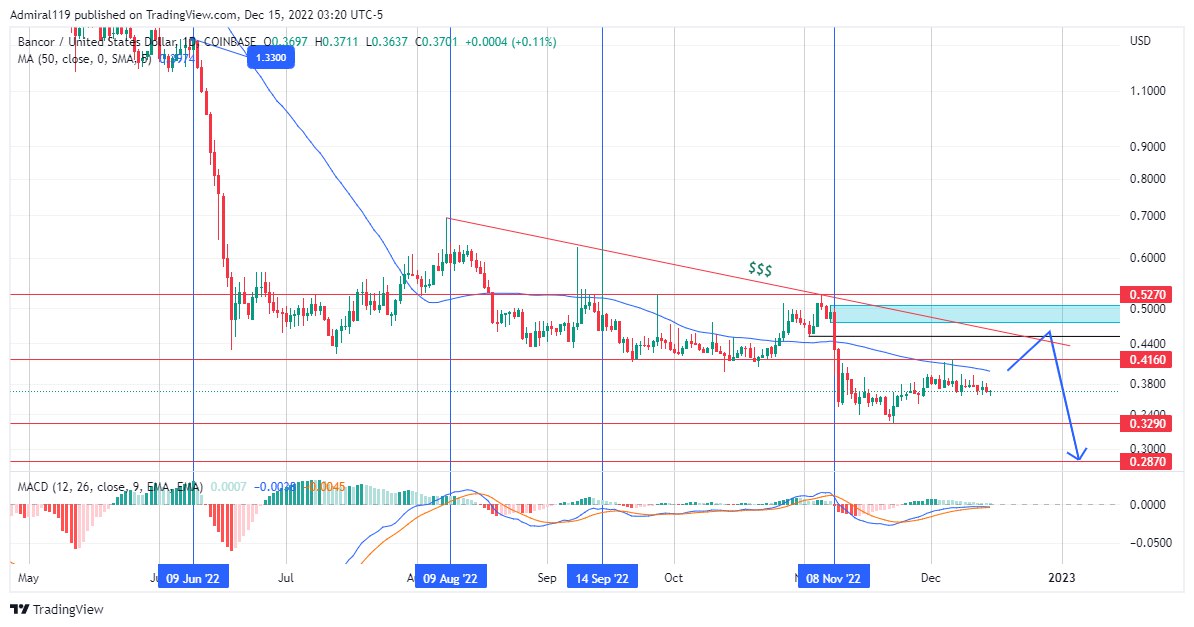
BNTUSD continues downward along the major trendline. With the 50-day Moving Average acting as a dynamic resistance, the price has been typically bearish for a long time on the daily chart.
BNTUSD Significant Zones
Demand Zones: 0.3290, 2870
Supply Zones: 0.4160, 0.0.5270
The bearish order block just below the supply zone at the 0.5270 price level appears to be attracting prices as the bears accumulate their sell orders. In the same manner, the Moving Average Convergence Divergence (MACD) indicator shows that the market is in a short-term rally. On June 9, 2022, BNTUSD crashed massively to the downside from a swing high at the 1.3300 price level. The massive crash was characterized by liquidity voids as the market sank deep into the discount zone. At 0.5270, the market’s momentum reduced slightly, making random movements until a major trend emerged on August 9, 2022.
The major trendline, on the other hand, is currently acting as diagonal resistance, limiting the retracement moves at their swing highs. On September 14, 2022, the price hit the major trendline again for the second time, and the market experienced an inhibited movement just below the 0.5270 price level. This continued until the major trendline was hit a third time. BNTUSD crashed massively from here into the demand zone at the 0.3290 price level, leaving a bearish order block behind during the movement. Until the daily bearish order block around the 0.5270 supply zone is invalidated, the market’s order flow remains bearish.
Market Expectation
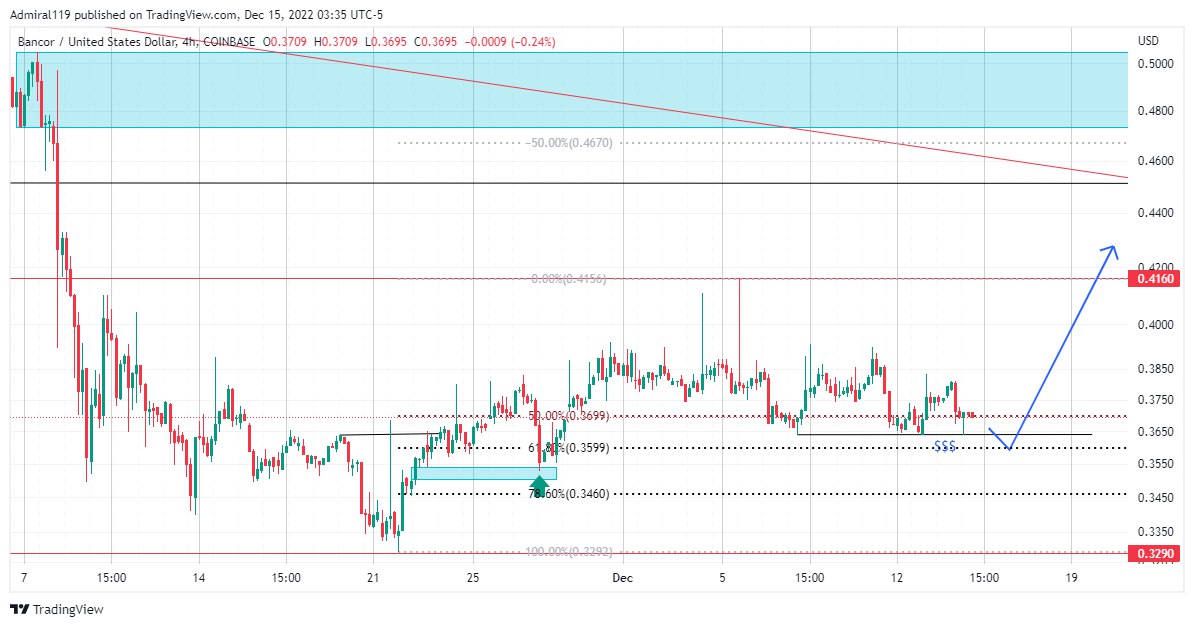
The 0.3290 and 0.4160 price levels define the current trading range of the market on the four-hour chart. BNTUSD is expected to grab sell-side liquidity at the discount price level. Afterward, experience an upward expansion toward the major trendline.
You can purchase Lucky Block here. Buy LBLOCK
Note: Cryptosignals.org is not a financial advisor. Do your research before investing your funds in any financial asset or presented product or event. We are not responsible for your investing results.