Bitcoin (BTC/USD) Price Features Close Beneath $50,000
Estimated Reading Time: 3 minutes
Don’t invest unless you’re prepared to lose all the money you invest. This is a high-risk investment and you are unlikely to be protected if something goes wrong. Take 2 minutes to learn more
Bitcoin Price Prediction – September 19
The BTC/USD price now features close beneath the $50,000 resistance level since about a couple of variant trading days’ operations. The crypto market’s valuation trades around $48,074 at a relatively negative percentage rate of around 0.63 as of writing.
BTC/USD Market
Key Levels:
Resistance levels: $50,000, $52,500, $55,000
Support levels: $45,000, $42,500, $40,000
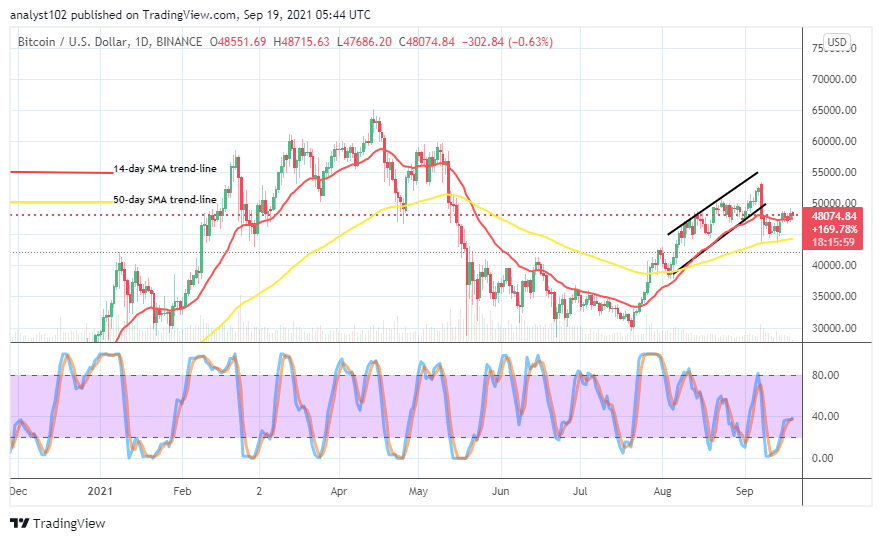
BTC/USD – Daily Chart
The BTC/USD daily chart showcases that the crypto’s price features are close to $50,000. Over time, there have been several failing attempts by the crypto to surge past the level. The 50-day SMA trend line is below the 14-day SMA trend line. A series of candlesticks have formed closely above the smaller SMA in the ranges of the point mentioned earlier and $45,000. The Stochastic Oscillators have closed the lines at range 40, indicating a kind of sideways motion is ongoing.
Could there be a re-occurrence of ranging moves in the BTC/USD market as price features close beneath $50,000?
It currently appears that there can be a re-occurrence of ranging moves in the BTC/USD market much more the crypto-economic price now features close beneath $50,000. Price needed to slide a bit so that there be a strong support baseline for bulls. In the wake of that, a retest of support line around $45,000 line will be ideally technical to prepare for another round of rebounding motions.
On the downside, the BTC/USD market bears have to be wary of price motion making a move in an attempt to breach past the immediate resistance level at $50,000. Presently, traders would have to focus more on the direction the market may be tempting to go after the current line of ranging movements closely beneath the $50,000. A significant sign of observation at a higher zone that price loses an upward pressure may mark a start of another slippage. That can be timely observed at the lower time chart, especially the 1-hour chart, closely corresponding with that of the 4-hour’s.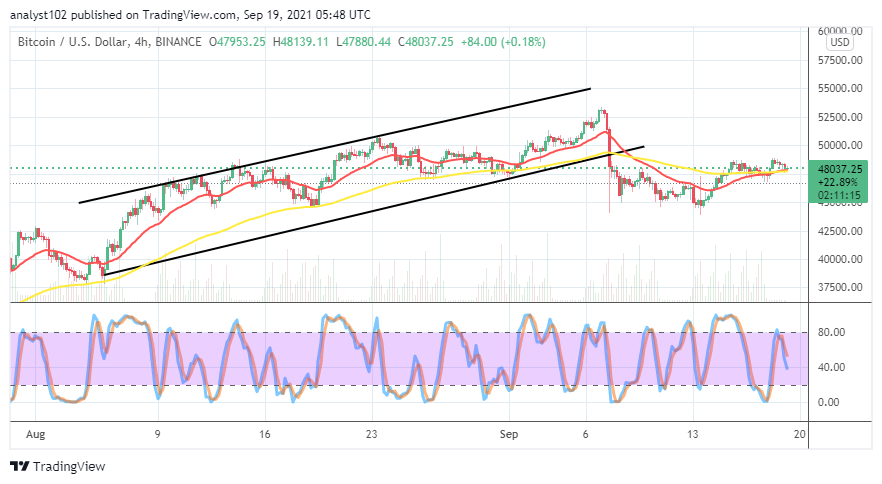
BTC/USD 4-hour Chart
The BCT/USD medium-term chart reveals that the crypto market price features close beneath $50,000. There have been candlesticks primarily around the line of $47,500 but, much of them have been to the upside of the point. There has now been a slight interception of the 50-day SMA trend line by the 14-day SMA trend line from the beneath to the north side. The Stochastic Oscillators have crossed the lines southbound between the ranges of 80 and 40, yet, pointing to the down direction. That suggests that the next move may be to favor the bears to some extent.
Note: Cryptosignals.org is not a financial advisor. Do your research before investing your funds in any financial asset or presented product or event. We are not responsible for your investing results.
You can purchase crypto coins here. Buy Tokens