$SPONGE (SPONGE/USD) Market Continues to Hold Position Above $0.0004
Estimated Reading Time: 2 minutes
Don’t invest unless you’re prepared to lose all the money you invest. This is a high-risk investment and you are unlikely to be protected if something goes wrong. Take 2 minutes to learn more
The $SPONGE market has recently been a theater of intense market dynamics, with both bulls and bears showcasing their influence. Notably, the SPONGE/USD pair recently breached the significant $0.0004 threshold, a testament to the bulls’ determination. Yet, this ascent wasn’t without its challenges, as the market encountered robust bearish responses around this crucial mark.
One can’t overlook the intriguing upper shadows observed on the latest candlesticks, suggesting fleeting bullish moments. However, the sustainability of this bullish fervor remains a point of contention.
Key Price Levels:
- Resistance: $0.00047, $0.00050, and $0.00060.
- Support: $0.000350, $0.00030, and $0.00025.
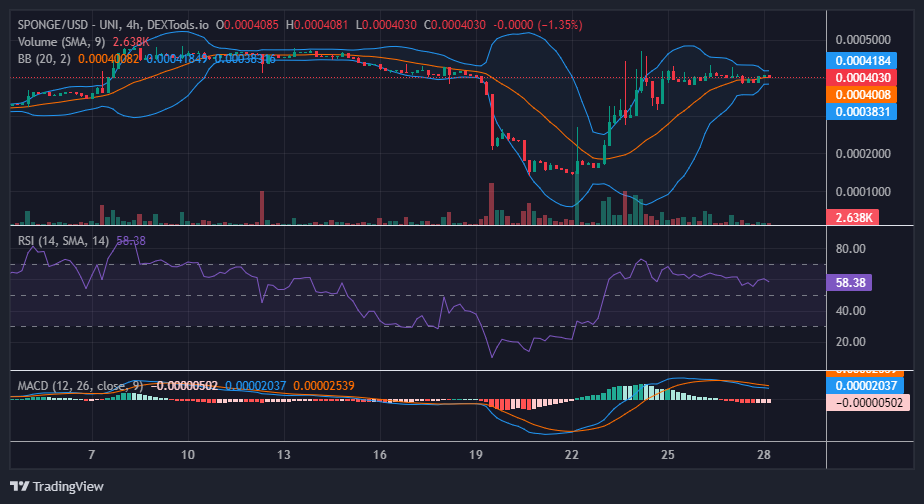
Deep Dive into $SPONGE’s Technical Landscape:
The recent ascendancy past the $0.0004 barrier by the bulls marks a significant shift in market sentiment. Previous analyses had painted a more subdued picture, with the price wavering beneath this threshold. Now, however, the bulls seem poised to challenge historical bearish patterns.
Technical aficionados will find the Bollinger Bands particularly intriguing. Their current configuration hints at market indecision, often a precursor to pronounced directional shifts. Further enriching this analysis is the Relative Strength Index (RSI) value of 61.26. Beyond signaling the present bullish momentum, this metric suggests promising upward potential.
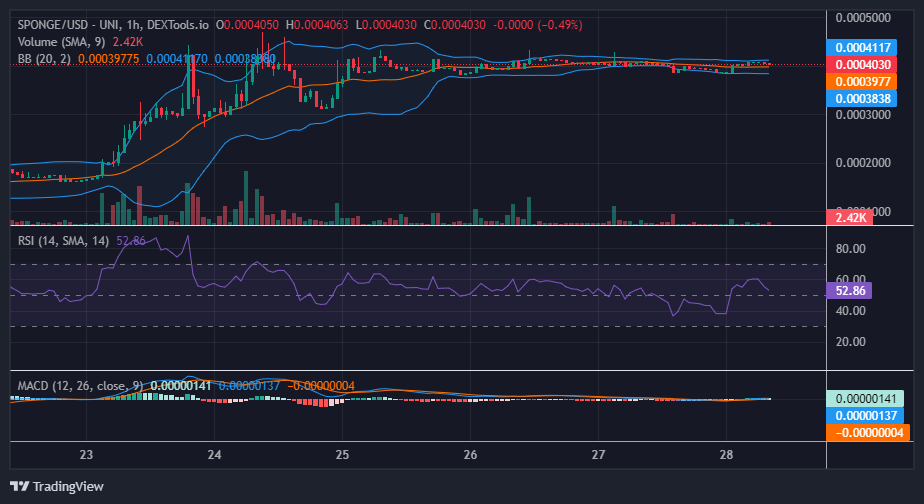
Insights from the Short-Term 1-Hour Chart:
The $SPONGE market’s present phase, characterized by the Bollinger Bands’ constriction, seems to lean favorably towards the bulls. This sentiment is reinforced by the emergence of slightly elevated lows, indicating the bulls’ latent power. As the Bollinger Bands contract, traders keenly anticipate potential breakout scenarios, which historically present attractive trading windows.
Buy $SPONGE and absorb more damp!
Join our #Sponge community of over 13,000 holders! 🧽💦
Don’t miss out on #SpongeV2! 🚀🔥$SPONGE #Web3 #Crypto #Altcoins pic.twitter.com/iQA8O7xxhu
— $SPONGE (@spongeoneth) December 28, 2023
Invest in the hottest and best meme coin. Buy Sponge ($SPONGE) today!