$SPONGE (SPONGE/USD) Market Update: Bulls Surge Past $0.0004 Amidst Bearish Resistance
Estimated Reading Time: 3 minutes
Don’t invest unless you’re prepared to lose all the money you invest. This is a high-risk investment and you are unlikely to be protected if something goes wrong. Take 2 minutes to learn more

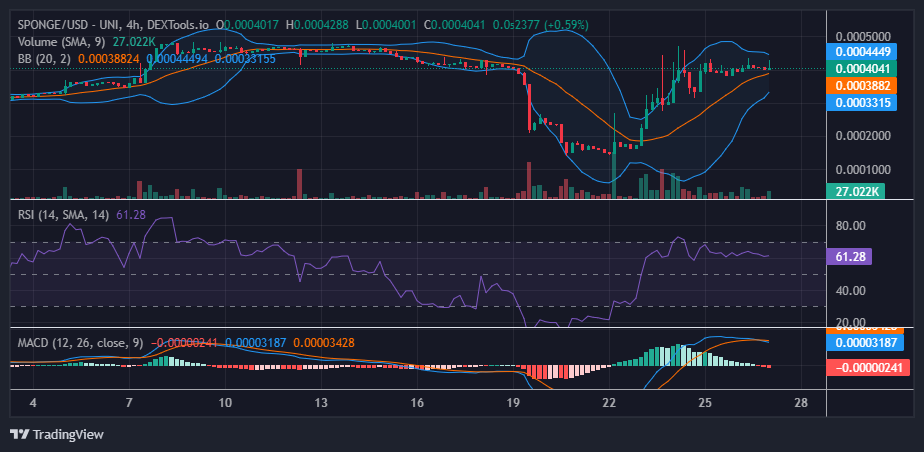
In a recent turn of events, the SPONGE/USD market has witnessed a notable tug-of-war between bullish and bearish sentiments. Over the course of the last two trading sessions, there was a fleeting moment when the bulls managed to propel the SPONGE/USD pair above the crucial $0.0004 mark. However, as the market tried to find its footing, it was met with a strong bearish response, particularly evident around this pivotal price level. An intriguing detail to note is the distinct upper shadows seen on two of the most recent candlesticks, suggesting a brief stint of bullish enthusiasm, albeit with questions regarding its longevity.
Key Price Levels:
- Resistance: $0.00047, $0.00050, and $0.00060.
- Support: $0.000350, $0.00030, and $0.00025.
Deciphering the Technicals for $SPONGE (SPONGE/USD):
The recent triumph of the bulls in reclaiming the $0.0004 level is noteworthy, especially considering its recent history of succumbing to bearish pressures. Prior analyses painted a picture of the price oscillating precariously beneath the $0.0004 mark. However, the narrative has shifted, with the bulls now showcasing their resilience.
Delving deeper into the technical indicators, the Bollinger Bands present a tale of market indecisiveness. Such patterns often precede a significant directional move, leaving traders on tenterhooks. Moreover, the Relative Strength Index (RSI) offers further insights, currently standing at 61.26. This value not only indicates the ongoing bullish momentum but also hints at the potential for further upward price traction.
Short-Term Projection on the 1-Hour Chart:
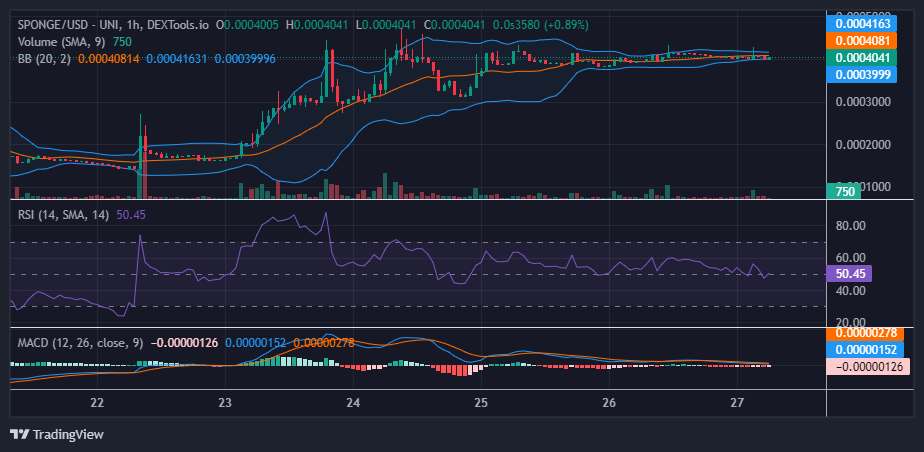
While the market grapples with its current consolidation phase, as highlighted by the Bollinger Bands’ contraction, there’s a discernible tilt in favor of the bulls. This bias is underscored by the formation of a marginally higher low, signaling the bulls’ underlying strength. The tightening of the Bollinger Bands, traditionally a sign of reduced volatility following a period of erratic price movements, now stands as a beacon for traders. Such narrowing frequently acts as a precursor to an impending breakout, setting the stage for potentially lucrative trading opportunities.
In conclusion, the $SPONGE (SPONGE/USD) market is at a crossroads, with traders eagerly awaiting the next decisive move. As the market narrative unfolds, all eyes will be on the Bollinger Bands and other technical indicators, providing invaluable insights into the potential trajectory of this intriguing cryptocurrency pair.
The new Sponge #P2E game will be available for both free and purchase.
Exciting News! 🧽🚀
There will be a free and paid version of the new Sponge #P2E game.
You can play for fun on the free version, or use $SPONGEV2 tokens to purchase additional game credits and earn more $SPONGE 😎#MemeCoin #Presale #Crypto pic.twitter.com/kJsqBY3wQ3
— $SPONGE (@spongeoneth) December 27, 2023
Invest in the hottest and best meme coin. Buy Sponge ($SPONGE) today!