Litecoin (LTC/USD) Market Extends Increases, Eyeing $100
Estimated Reading Time: 3 minutes
Don’t invest unless you’re prepared to lose all the money you invest. This is a high-risk investment and you are unlikely to be protected if something goes wrong. Take 2 minutes to learn more
Litecoin Price Prediction – March 5
A significant conducive uprising pressure has been seen in the performances of Litecoin market bulls against the valuation of the US currency, as the situation is currently such that the crypto extends increases, eyeing the resistance of $100.
According to a close technical outlook at the time of this analysis, trade lines between $90 and $80 must be the places where forces pushing farther northward must continue to advance. If the price remains above these levels and a full bearish candlestick is developed, that might lead to a crypto signal that supports a strong reversal of some of the price appreciation before the market starts to climb again at a later time.
LTC/USD Market
Key Levels:
Resistance levels: $100, $110, $120
Support levels:$80, $75, $70
LTC/USD – Daily Chart
The LTC/USD daily chart reveals that the crypto business operation extends increases, eyeing the price resistance line of $100.
From the overbought zone across the 80, the stochastic oscillators are assuming a pre-positional posture in a brief mode. However, they are making an attempt to construct a crossing that could indicate the need for a brief stop. The top side of the Bollinger Band trend lines is extending upward, suggesting that buying velocities are not yet giving way to a shift in other directions.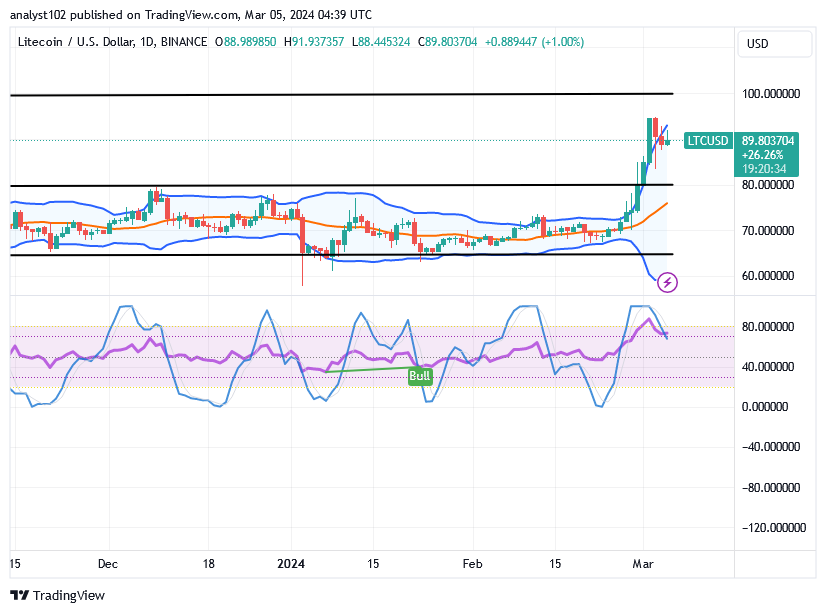
At this point, which underlying support line has to act as the critical area for the current advances in the LTC/USD market?
A trade surrounding $80 has been seen to act as a crucial support point against any possibility of seeing the LTC/USD trade tend to correct steadily, given that the crypto currently extends increases against the American coin, eyeing the point of $100.
Given that it has been rationally determined that the $90 and $80 marks represent the zones in which long-position movers must maintain momentum, they ought to be aware of the times at which there will be a significant resurgence of active price action to support their choices.
The forces on the north road are probably going to become extinct for a few days or weeks, as demonstrated by the drawing of a horizontal line around the $100 mark and a noteworthy cross of the upper Bollinger Band trend line to the downside above a bearish candlestick. A breakout of $100 will, however, unquestionably refute those predictions.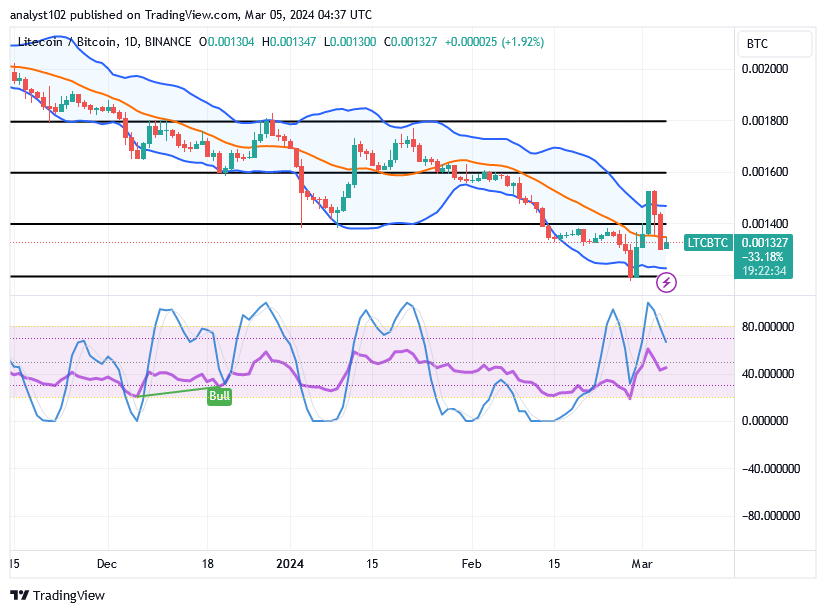
LTC/BTC Price Analysis
In contrast, Litecoin’s price movement initially extends increases against the market worth of Botcoin in lower zones.
The Bollinger Band indicators are still pointing downward in a systematic fashion. That suggests the counter-crypto is positioned to outperform the base instrument. In an attempt to avoid potentially plunging too long at lower points before shifting to the moon side, the stochastic oscillators are leaning somewhat southerly from the overbought area. It shows that the LTC market may soon recover some of the catalysts that it lost to BTC.
Note: Cryptosignals.org is not a financial advisor. Do your research before investing your funds in any financial asset or presented product or event. We are not responsible for your investing results.
You can purchase Lucky Block here. Buy LBLOCK