Ripple Declines above $0.47 As Sellers Emerge in the Overbought Region
Estimated Reading Time: 3 minutes
Don’t invest unless you’re prepared to lose all the money you invest. This is a high-risk investment and you are unlikely to be protected if something goes wrong. Take 2 minutes to learn more

Free Crypto Signals Channel
Ripple (XRP) Long-Term Analysis: Bearish
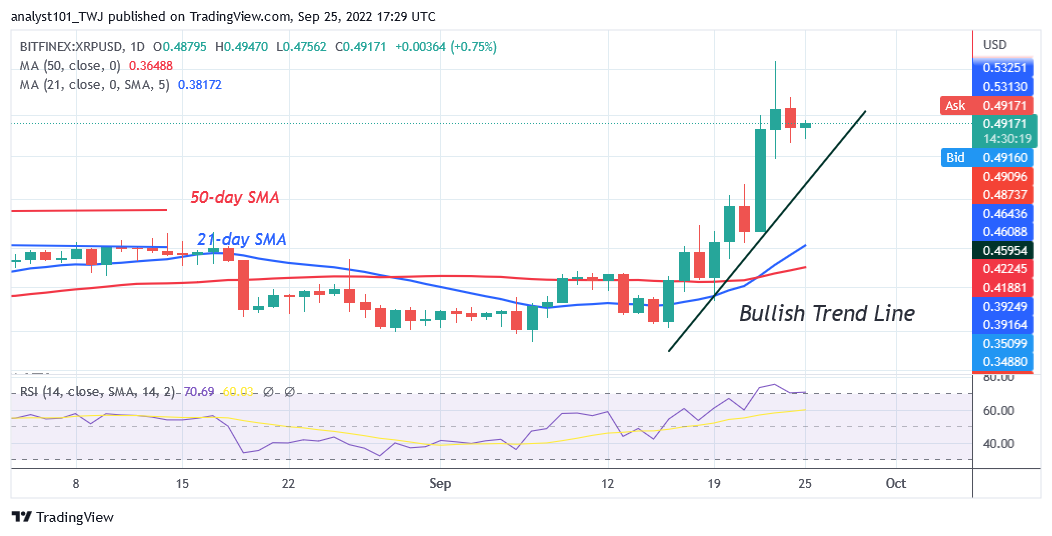
Ripple’s (XRP) price is in an uptrend as sellers emerge in the overbought region. The uptrend has been terminated as the altcoin faces rejection in the overbought region of the market. XRP has retraced above the $0.47 support and resumed consolidation above it. On the upside, XRP will resume an uptrend if price breaks the resistance at $0.55. The market will further rise to the high of $0.65. On the downside, if the selling pressure resumes and breaks below the moving average lines or the trend line, the uptrend will be terminated. In other words, the downtrend will resume as price breaks below the moving average lines. In the meantime, XRP is trading at $0.48 and it is above the moving average lines.
Ripple (XRP) Indicator Analysis
XRP is at level 70 of the Relative Strength Index for period 14. It indicates that XRP has reached the overbought region of the market. Sellers have emerged in the overbought region of the market to push prices down. The selling pressure will be accelerated if price breaks below the moving average lines. XRP’s price is above the moving average lines which indicates a further upward movement of the coin. The altcoin is below the 50% range of the daily stochastic. It indicates that the market is in a bearish momentum.
Technical indicators:
Major Resistance Levels – $0.80, $1.00, $1.20
Major Support Levels – $0.60, $0.40, $0.20
What Is the Next Direction for Ripple (XRP)?
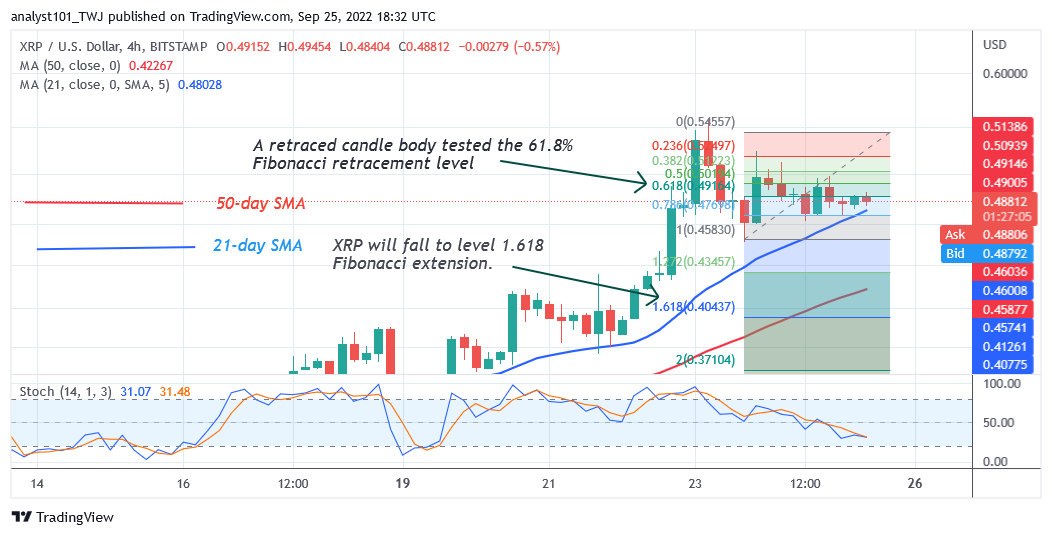
Ripple is in a minor retracement as sellers emerge in the overbought region. The selling pressure will resume if price breaks below the moving average lines. Meanwhile, on September 23 downtrend; a retraced candle body tested the 61.8% Fibonacci retracement level. The retracement suggests that XRP will fall to level 1.618 Fibonacci extension or $0.40 low.
You can purchase crypto coins here. Buy LBLOCK
Note: Cryptosignals.org is not a 1a financial advisor. Do your research before investing your funds in any financial asset or presented product or event. We are not responsible for your investing results