Bitcoin Cash (BCH/USD) Hustles at Lower Range Zone
Estimated Reading Time: 3 minutes
Don’t invest unless you’re prepared to lose all the money you invest. This is a high-risk investment and you are unlikely to be protected if something goes wrong. Take 2 minutes to learn more
Bitcoin Cash Price Prediction – June 18
It appears that there has a continued market movement in the BCH/USD featuring how price hustles at the lower trading level of $600. The crypto now records a negative percentage rate of -0.58 to trade around the value of $595.
BCH/USD Market
Key Levels:
Resistance levels: $800, $1,000, $1,200
Support levels: $500, $400, $300
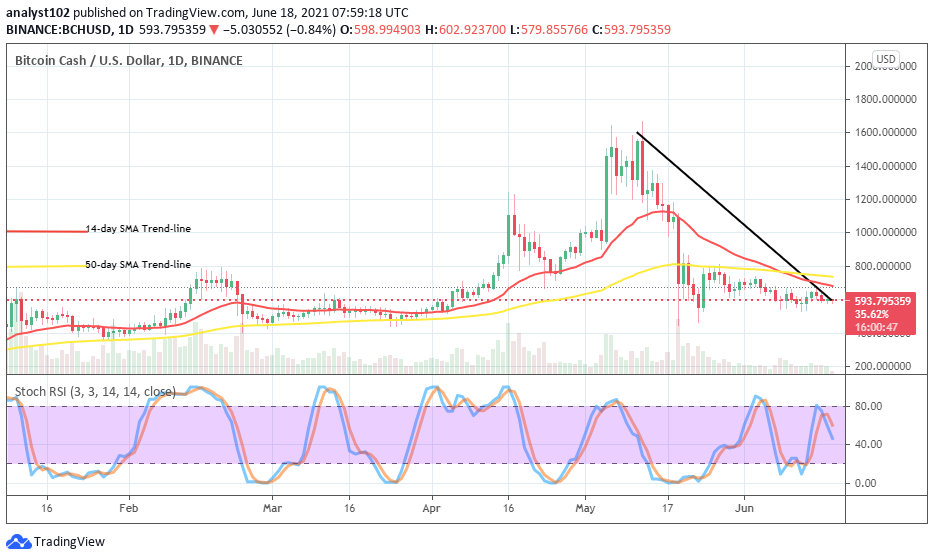
BCH/USD – Daily Chart
The BCH/USD daily chart currently depicts that the crypto’s value is relatively hustling around the lower range spot that it has long been kept overly. The 14-day SMA trend-line is located underneath the 50-day SMA indicator with a very small space separating them. The smaller SMA is more pointing toward the east than any other direction to indicate that there is ongoing downward pressure in the market. The Stochastic Oscillators, in attestation to that indicator’s reading, also have crossed lines from range 80 down to point to the southbound a bit above range 40.
What could cause a change in the present price-ranging manner of the BCH/USD market?
Being as it is, there seems that in the near session no active price movement will still be made in the BCH/USD market. Even, the present reading of the trading indicators hasn’t been backed up with visible active moves over time. That is the reason why the market trades in range-bound zones until now. A breakdown of the $600 lower range will potentially provide an area of support for bulls to regain a stance.
The kind of pressure to the downside seems to lack the required weight to reliably depend upon. But, in the maim time; a line of smaller downward pressures seems to be in the offing. The indicator analyzing the market yet maintains a posture in pointing to the south direction. Testing of the smaller SMA trend-line from the underneath could mean that price will be seeing rejections against swing up.
BCH/BTC Price Analysis
In the comparison, the BCH/BTC price analysis chart reveals that the base crypto is on the verge of losing out in trending capacity to the flagship counter crypto. However, a slightly bullish outlook is still somewhat traceable that BCH still places on a tight higher trading level pairing with BTC as of writing. Variant daily smaller candlesticks are being formed below the 50-day SMA indicator as the 14-day SMA trend-line is located above it. The stochastic oscillators have moved from the oversold region to cross the lines in between ranges of 20 and 40 slightly toward the northbound. That indicates that the base instrument may soon regain its trending weight as placed with the counter tool in the near time.
Note: new.cryptosignals.org is not a financial advisor. Do your research before investing your funds in any financial asset or presented product or event. We are not responsible for your investing results.
You can purchase crypto coins here. Buy Tokens